
Figure 2.
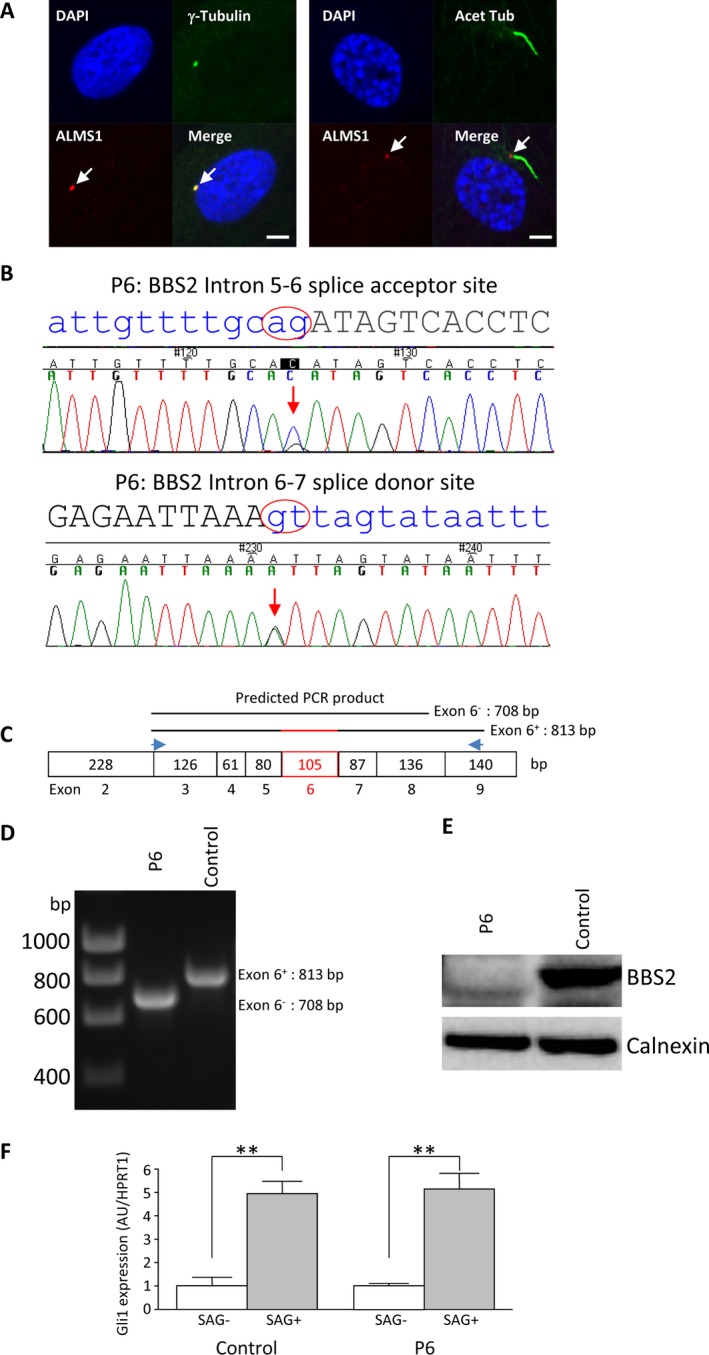
Analysis of P6 dermal fibroblasts. (A) Immunofluorescence staining of P6 fibroblasts revealing positive detection of ALMS1 and the primary cilium. Scale bars indicate 5 μm. (B) Sanger sequencing confirmation showing heterozygous mutations at the BBS2 (NM_031885.3) intron 5–6 splice acceptor site and intron 6–7 donor site. (C) Schematic representation of PCR analysis strategy, with a pair of primers flanking exon 6 giving rise to a product of predicted size 813 base pairs (bp) for the wild type and 708 bp for the mutant gene. (D) 1% agarose gel revealed a single PCR product of predicted size for control and the patient cells, respectively. (E) Lack of wild type BBS2 protein in the patient cells, as opposed to the control cells revealed by western blot analysis. (F) qPCR analysis of GLI1 expression (arbitrary unit: AU) in control and patient cells following 24 h serum starvation and subsequent 24 h SAG treatment with housekeeping gene HPRT1 as loading control. Results are reported as mean values ± SEM and are expressed as fold change with respect to untreated controls, arbitrarily set as 1; **P < 0.01.