Figure 1.

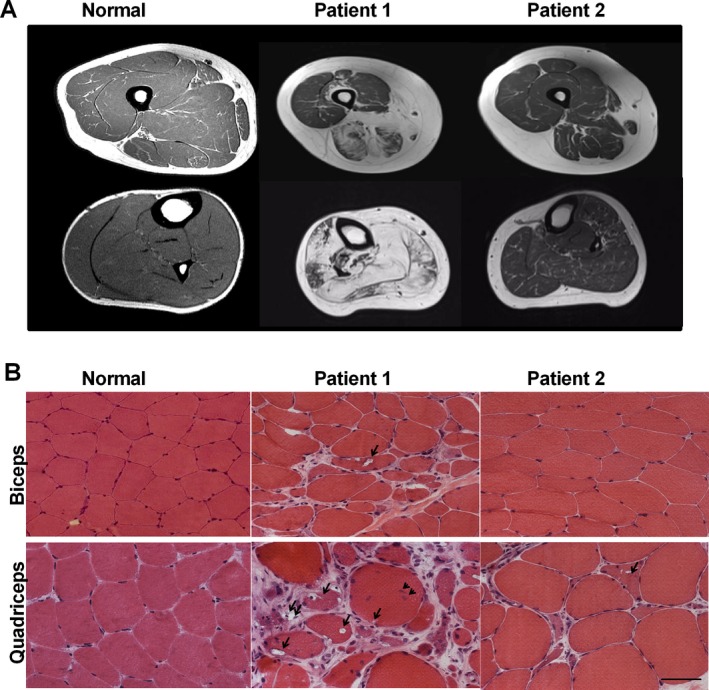
Muscle imaging and pathology. (A) T1‐weighted MRI of the thigh (upper panel) and lower leg (lower panel). Atrophy of hamstrings and lower leg muscles (Patient 1) and the proximal anterior tibialis (Patient 2) gave rise to fatty infiltration, apparent as white on the MRI. (B) Muscle biopsies of biceps brachii and lower extremity muscles (gastrocnemius medialis in Patient 1, anterior tibialis in Patient 2, quadriceps femoris in Normal) show characteristic findings of GNE myopathy, including rimmed vacuoles (arrows), fatty and fibrous tissue replacement (double arrows), marked variation in fiber size, and central nucleation (arrowhead). Note that the biceps muscle of Patient 2 appears normal, except for a mild variation in fiber size. Scale bar = 50 microns.
