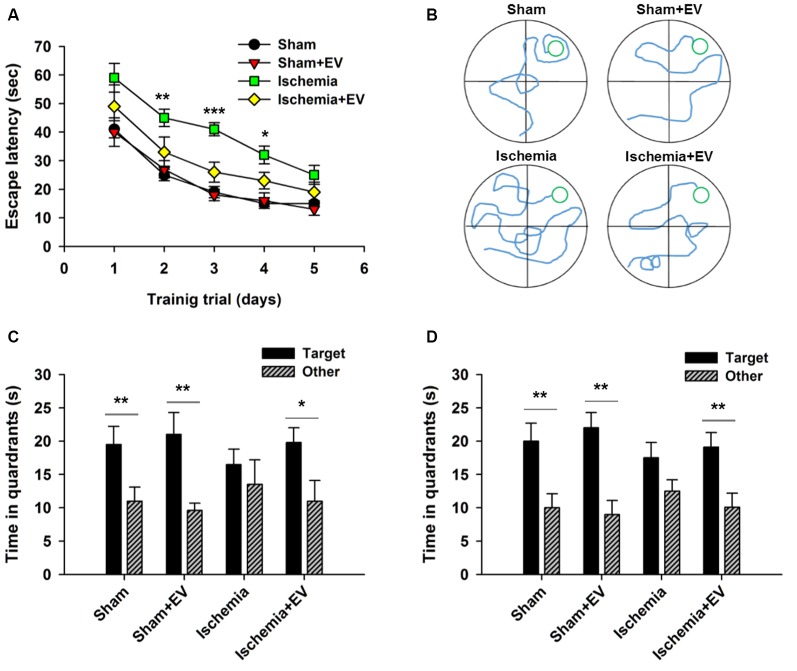
Figure 5.
Morris water maze (MWM) test of spatial learning and memory in BMSC-EV treated ischemic mice. (A) Escape latency measured as mean time (s) during training trials (day 2: sham = 25.1 ± 2.1, sham + EV = 26.8 ± 3.3, ischemia = 44.9 ± 3.1, ischemia + EV = 33.5 ± 5.3; day 3: sham = 18.7 ± 2.0, sham + EV = 17.6 ± 2.5, ischemia = 41.1 ± 2.3, ischemia + EV = 16.3 ± 3.5; day 4: sham = 14.8 ± 1.3, sham + EV = 16.8 ± 2.3, ischemia = 31.9 ± 3.1, ischemia + EV = 23.0 ± 2.8). (B) Representative swimming traces of the four groups of mice exhibited the training trial on day 3. (C) Time spent in target quadrant and other quadrants 24 h after the last training trial (sham: 19.5 ± 2.7 and 11.0 ± 2.1; sham + EV: 21.4 ± 3.6 and 9.6 ± 1.1; ischemia: 16.6 ± 2.4 and 13.5 ± 3.7; ischemia + EV: 19.8 ± 2.2 and 10.9 ± 3.1). (D) Time spent in target quadrant and other quadrants tested 7 days later (sham: 19.8 ± 2.6 and 11.6.0 ± 2.1; sham + EV: 22.3 ± 2.3 and 9.1 ± 1.9; ischemia: 17.5 ± 2.4 and 12.3 ± 1.8; ischemia + EV: 19.1 ± 2.5 and 10.8 ± 3.1). n = 12 per group. Data show means ± SEM. Two-way ANOVA analysis followed by a Tukey’s post hoc test for (A). Student’s t-test for (C,D). *p < 0.05, **p < 0.01 and ***p < 0.001.

