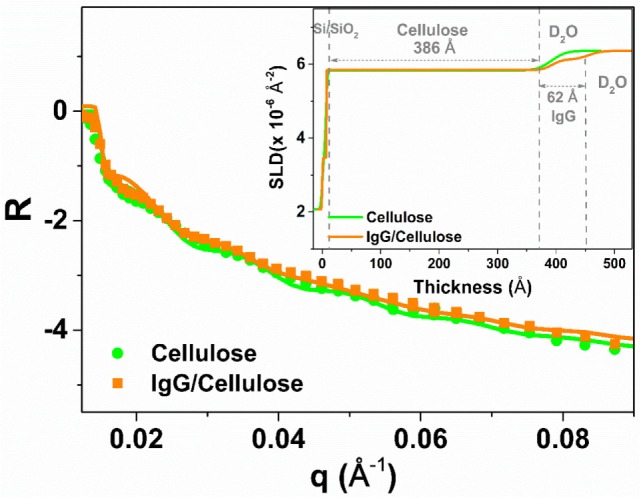
Figure 2.

Neutron reflectivity curves of the regenerated cellulose film (RCF in green with filled circles) and with the adsorbed immunoglobulin G layer (orange, filled squares) on the RCF in D2O buffer. The solid line shows the fit and the inset represents the plot of scattering length density variation with respect to the layers thickness.
