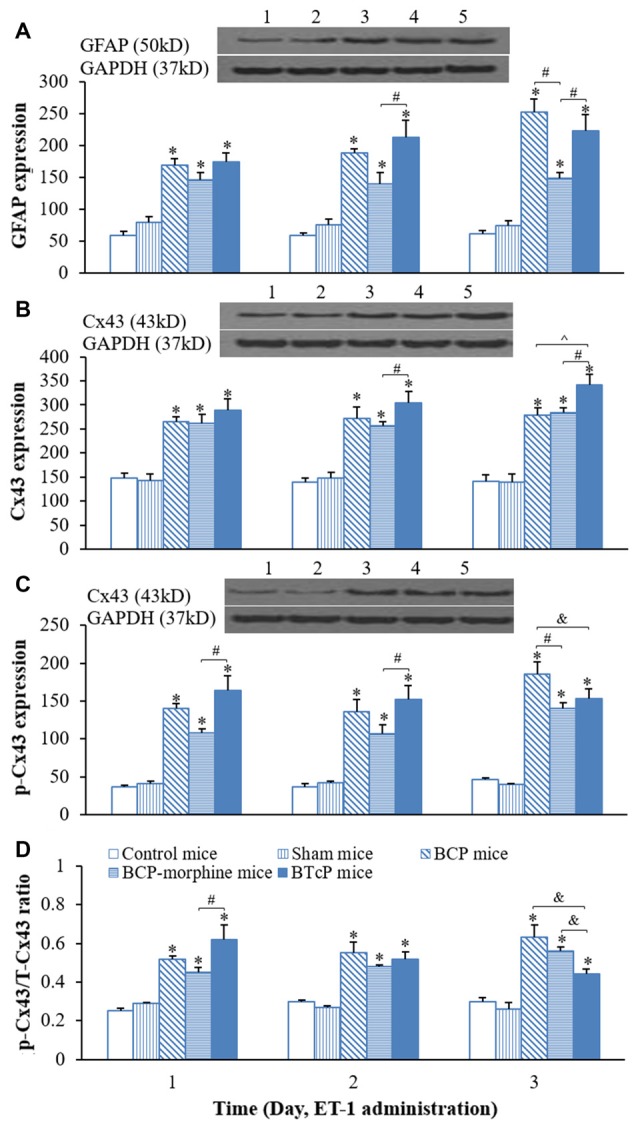
Figure 2.

Protein expressions of glial fibrillary acidic protein (GFAP) (A) Cx43 (B) p-Cx43 (C) and the ratio of p-CX43/T-Cx43 (D) in normal, sham, BCP, BCP-morphine and BTcP mice. The bands of Western blotting in (A–C): (1) protein extracts from the tissues of spinal cord in a representative control mice; (2) protein extracts from the tissues of spinal cord in a representative sham mice; (3) protein extracts from the tissues of spinal cord in a representative BCP mice; and (4) protein extracts from the tissues of spinal cord in a representative BCP-morphine mice; and (5) protein extracts from the tissues of spinal cord in a representative BTcP mice. Five mice were used for each group. GFAP, Cx43 and p-Cx43 were analyzed by Western blotting and the ratio of p-CX43/T-Cx43 was calculated from phosphonated Cx43 and total Cx43. *P < 0.05, vs. control or sham mice; #P < 0.05, vs. BCP-morphine mice; ∧P < 0.05, vs. BCP mice; &P < 0.05, vs. BTcP mice.
