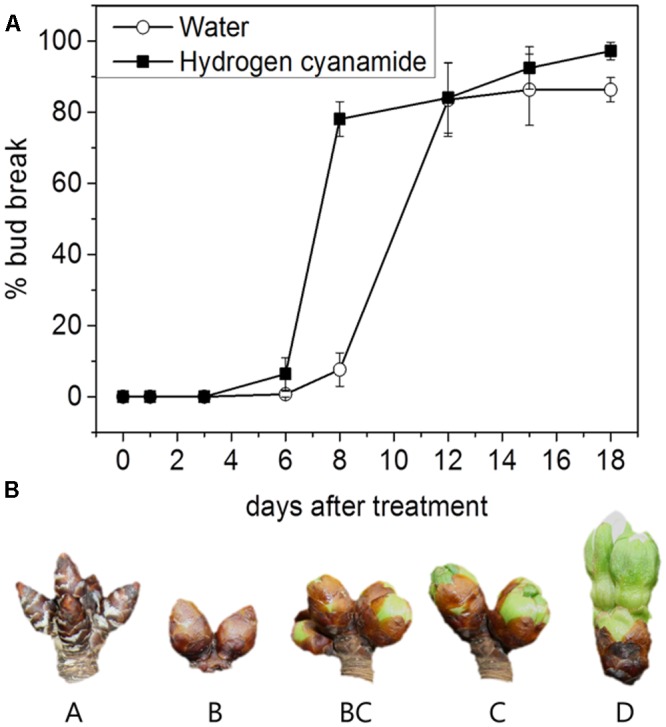
FIGURE 1.

(A) Bud break response of hydrogen cyanamide- and water-treated cherry flower buds at 0, 1, 3, 6, 8, 12, 15, and 18 days after treatment. Bars represent ± SEM of three biological replicates, i.e., on average 480 buds were analyzed per data point. (B) Developmental stages A–D of the sweet cherry flower buds sampled in this study.
