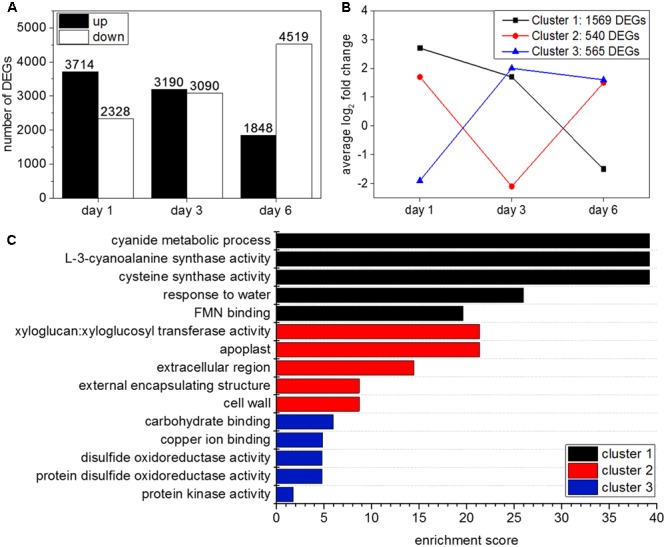
FIGURE 2.

(A) Number of differentially expressed genes (DEGs) with a log2 FC ≥ 1 and ≤ –1 and a FDR ≤ 0.05 at day 1, 3, and 6 after hydrogen cyanamide treatment. (B) Cluster analysis using Euclidian distance results in three main expression patterns of DEGs in hydrogen cyanamide-treated versus control flower buds. (C) Most enriched Gene Ontology terms in the three main expression clusters among the hydrogen cyanamide-responsive DEGs.
