FIGURE 4.

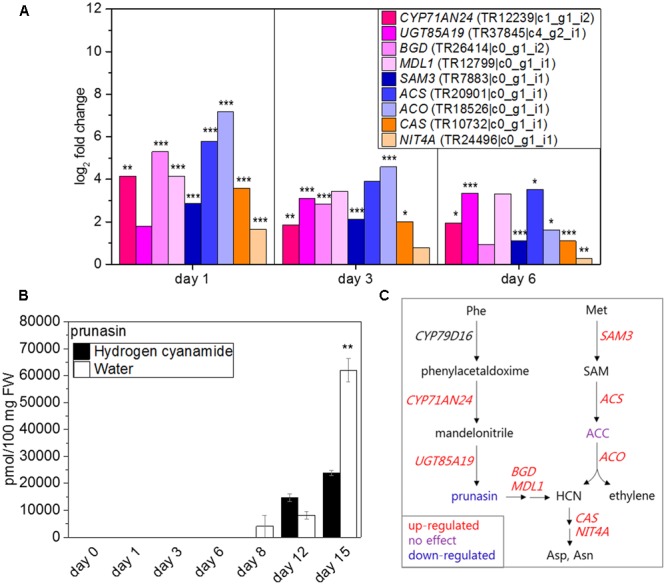
Effect of hydrogen cyanamide treatment on hydrogen cyanide- and ethylene-associated transcripts (A) and prunasin (B) levels in sweet cherry flower buds. Summary of the factors belonging to the cyanide/ethylene pathway that were found to be influenced by hydrogen cyanamide treatment in this study (C). Bars indicate ± SEM of three technical (B) and biological replicates (C), respectively. Asterisks in (A) indicate FDR as follows: ∗FDR ≤ 0.05, ∗∗FDR ≤ 0.01, ∗∗∗FDR ≤ 0.001. Asterisks in (C) indicate p-values as follows: ∗∗p ≤ 0.01 (Student’s t-test). ACC, 1-aminocyclopropane-1-carboxylate; ACS, 1-aminocyclopropane-1-carboxylate synthase; ACO, 1-aminocyclopropane-1-carboxylate oxidase; Asp, aspartate; Asn, asparagine; BGD, cyanogenic beta-glucosidase; CAS, cyanoalanine synthase; HCN, hydrogen cyanide; MDL1, mandelonitrile lyase 1; Met, methionine; NIT4A, nitrilase 4A; Phe, phenylalanine; SAM, S-adenosylmethionine; SAM3, S-adenosylmethionine synthase 3.
