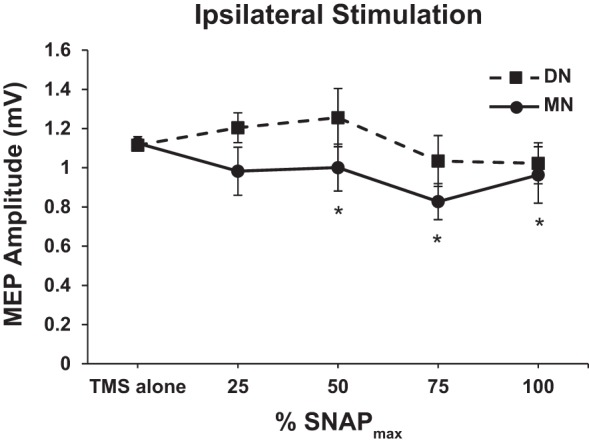
Fig. 4.

Ipsilateral stimulation (FDI only). Graph of both one-way Conover’s ANOVAs, 1 for each nerve. Group-averaged MEP amplitude (±SE) for each nerve at each percentage of SNAPmax. *Presence of LAI (i.e., significance difference from TMS alone) for ipsilateral MN stimulation at 50, 75, and 100% SNAPmax (Cohen’s d = 0.35, 1.07, 0.39, respectively). LAI was not present at any SNAP amplitude following ipsilateral DN stimulation. For MN stimulation, n = 16 for all %SNAPmax intensities. For DN stimulation, n = 15 for all %SNAPmax intensities.
