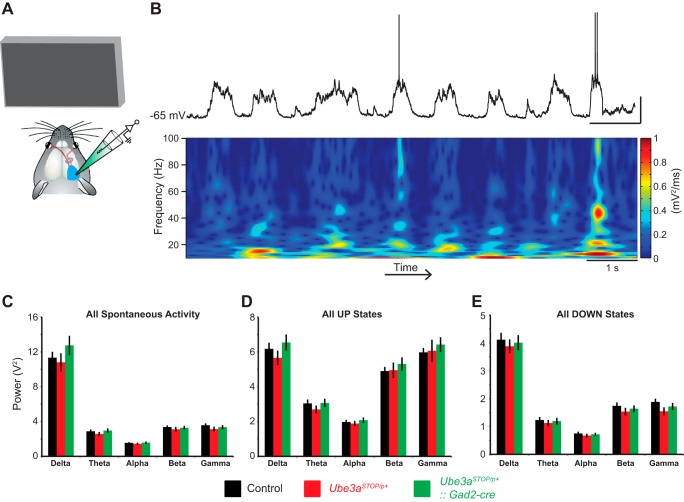
Fig. 3.
Spectral analysis of spontaneous UP/DOWN states in L2/3 RS neurons. A: schematic of recording configuration during spontaneous activity (note that animal is presented with a gray screen stimulus). B: sample recording of a spontaneously active L2/3 RS neuron (top) and corresponding spectrogram (bottom) (scale bar = 1 s, 20 mV). C: average power spectrum of spontaneous activity of individual L2/3 RS neurons for control (n = 24), Ube3aSTOP/p+ (n = 19), and Ube3aSTOP/p+::Gad2-Cre (n = 18) mice. Frequency ranges are defined as delta (0.5–4 Hz), theta (4.5–8 Hz), alpha (8.5–12 Hz), beta (12.5–29.5 Hz), and gamma (30–80 Hz) (2-way ANOVA, P = 0.462). D: average power spectrum of UP states of individual L2/3 RS neurons for control (n = 24), Ube3aSTOP/p+ (n = 19), and Ube3aSTOP/p+::Gad2-Cre (n = 18) mice (2-way ANOVA, P = 0.58). E: average power spectrum of DOWN states of individual L2/3 RS neurons for control (n = 24), Ube3aSTOP/p+ (n = 19), and Ube3aSTOP/p+::Gad2-Cre (n = 18) mice (2-way ANOVA, P = 0.53).

