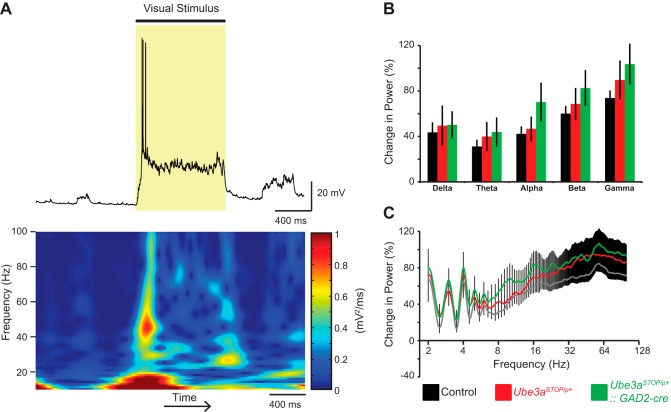
Fig. 4.
Spectral power changes induced with visual stimulation. A: sample recording of a L2/3 RS neuron during 1 s of visual stimulation (shaded region, top) and corresponding spectrogram of recording (bottom). B: average change in power with visual stimulation at different frequency bands for control (n = 31), Ube3aSTOP/p+ (n = 26), and Ube3aSTOP/p+::Gad2-Cre (n = 23) mice (2-way ANOVA, P = 0.542). Frequency ranges are defined as delta (2–4 Hz), theta (4.5–8 Hz), alpha (8.5–12 Hz), beta (12.5–29.5 Hz), and gamma (30–80 Hz). C: average change in power with visual stimulation for all frequencies for control (n = 31), Ube3aSTOP/p+ (n = 26), and Ube3aSTOP/p+:: Gad2-Cre (n = 23) mice.

