Fig. 7.
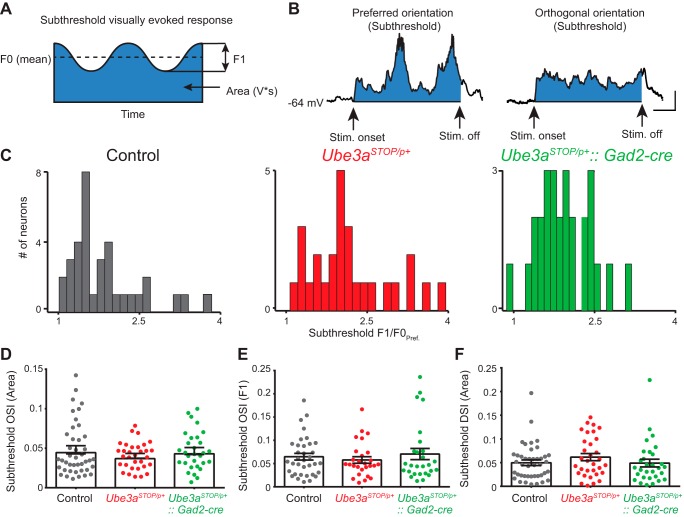
Subthreshold orientation tuning is unchanged in Ube3aSTOP/p+ mice. A: illustration of the measurements made for the subthreshold analysis of visual responses. F0 is the mean subthreshold membrane potential, F1 is the difference between the peak and trough of the subthreshold membrane potential, and blue shaded region corresponds to the Area (V × s) measurement. All measurements are made during presentation of the visual stimulus. B: sample recording from a L2/3 RS neuron to drifting gratings in its preferred and orthogonal orientations. Blue shaded region indicates the zone representing the “Area” measurement or subthreshold synaptic response to visual stimulation. The recordings are averages of 6 presentations of the same orientation and low-pass filtered at 100 Hz. (note that this neuron had significant subthreshold F1 modulation to the preferred orientation) (scale bar 200 ms, 5 mV). C: histograms of subthreshold F1/F0 measurements at the neuron’s preferred orientation (F1/F0Pref). D: orientation selectivity index measured from subthreshold (Area) orientation tuning curves from control (n = 42), Ube3aSTOP/p+ (n = 32), and Ube3aSTOP/p+::Gad2-Cre (n = 30) mice (Kruskal-Wallis test, P = 0.774). E: orientation selectivity index measured from subthreshold F1 from control (n = 35), Ube3aSTOP/p+ (n = 27), and Ube3aSTOP/p+::Gad2-Cre (n = 27) mice (Kruskal-Wallis test, P = 0.85). F: direction selectivity index measured from subthreshold (Area) orientation tuning curves from control (n = 42), Ube3aSTOP/p+ (n = 32), and Ube3aSTOP/p+::Gad2-Cre (n = 30) mice (ANOVA, P = 0.393).

