Figure 2.
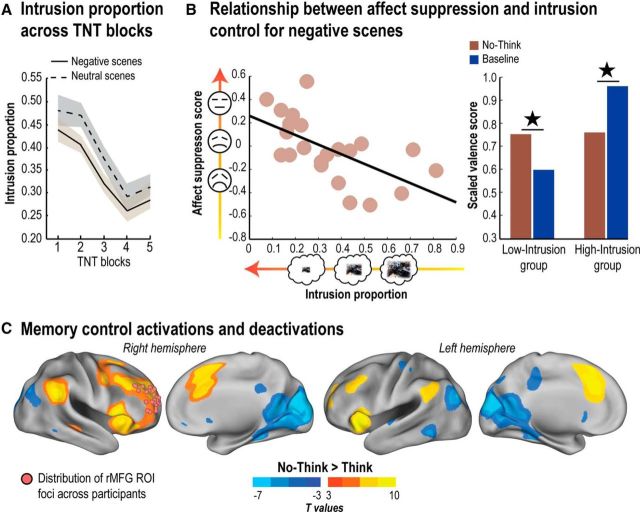
Behavioral and neural indices of mnemonic and affective regulation. A, Intrusion proportions (i.e., the proportion of trials in which the associated memory entered into awareness on No-Think trials as measured by our trial-by-trial intrusion report measure; see Procedure) over the five scanning blocks of the TNT phase. Shaded error bands represent within-participant SDs. B, Left, The relationship between intrusion proportion and affect suppression score (No-Think − Baseline) for Negative scenes. Right, Participants who were better at controlling intrusions of unpleasant scenes also showed reduced negative feelings toward them afterward. ★p < 0.05. C, Brain areas more engaged by retrieval suppression than by retrieval (No-Think > Think; hot colors) and vice versa (No-Think < Think; cold colors), thresholded at the uncorrected level of p < 0.001 for visualization purposes. Pink spheres represent right MFG ROI foci across participants used in subsequent activation, correlation, and DCM analyses (see Materials and Methods). These ROIs were derived from individual local maxima centered around the supramodal control system described by Depue et al. (2015) and are projected onto a common standard space for visualization purposes. Statistical parametric maps were rendered on the top of the PALS human surface using Caret software (Van Essen et al., 2001) (RRID:SCR_006260).

