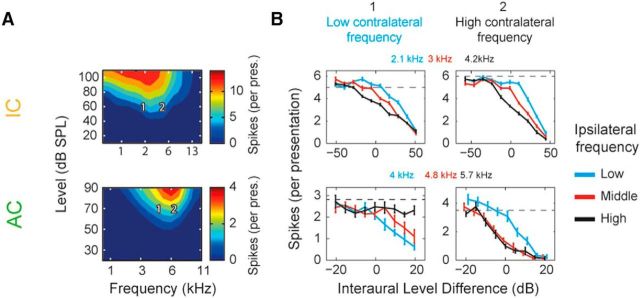
Figure 3.
Single-cell examples demonstrating binaurally inhibitory cells compare ILDs over a restricted frequency range in AC (top row), but not in IC (bottom row). A, FRAs of the monaural contralateral ear. Color represents the number of spikes (per presentation) at each frequency (x-axis) and level (y-axis) combination. Numbers indicate the contralateral frequencies chosen for further investigation. B, ILD functions were collected using a low-frequency (1) and high-frequency (2) contralateral tone and different ipsilateral tone frequencies (low, middle, and high; exact frequencies are shown above panels).

