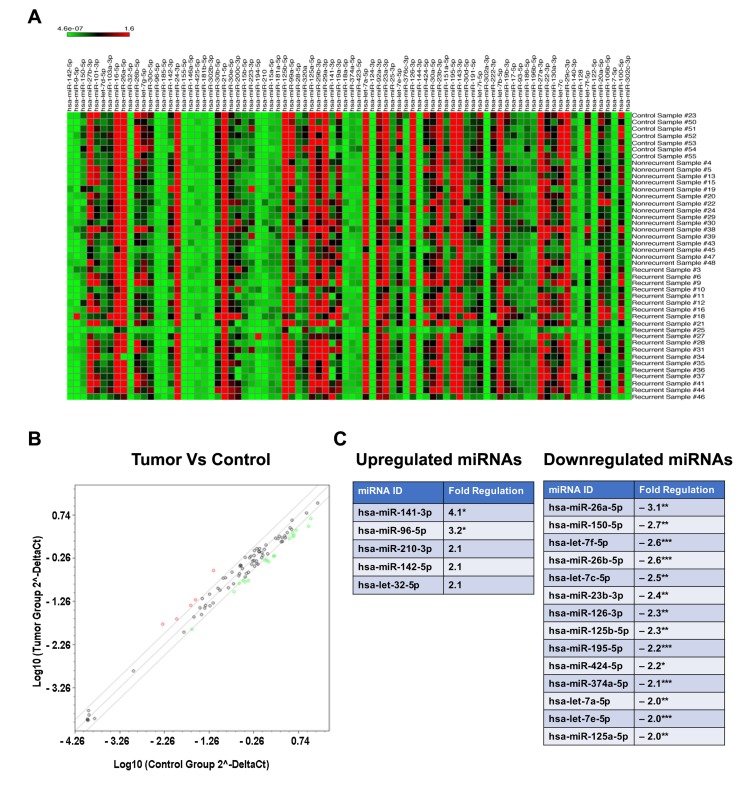
Figure 1. Expression analysis of miRNAs in FFPE samples from endometrial cancer patients.
Heat map and scatter plot images represent results from miRNA profiling using FFPE samples derived from normal or endometrial cancer patients by RT-qPCR. A. Heat map shows differential miRNA expression profiles between normal and endometrial cancer patient derived samples. Upregulated genes are shown in red and downregulated genes are in green. B. In the scatter plot, upregulated miRNAs (> 2-fold) are denoted by red circles and downregulated miRNAs (< 2-fold) are denoted by green open circles. C. Upregulated and downregulated miRNAs in FFPE samples from endometrial cancer tissue along with the fold changes are listed. Significant differences in the fold changes are indicated by p-values: * - <0.05; ** - <0.01; *** - <0.001.

