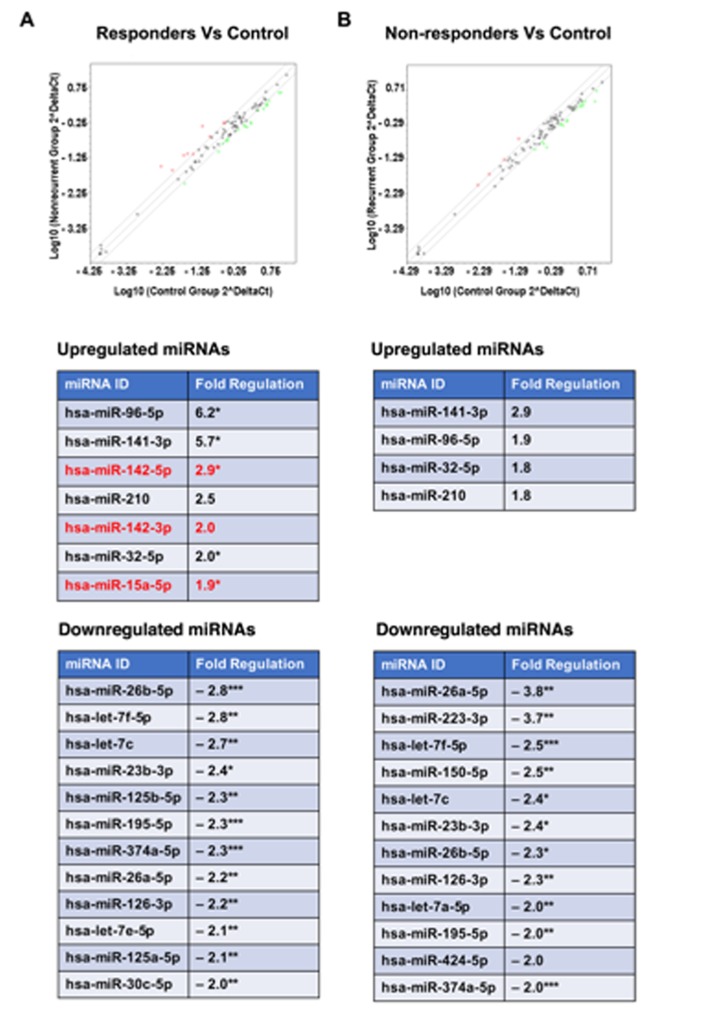
Figure 4. Expression analysis of miRNAs in FFPE samples from different therapy response groups.
MiRNAs expression profiles in FFPE samples derived from endometrial cancer patients grouped as “non-recurrent/responder” (PFS > 21 months) and recurrent/non-responder (PFS < 21 months) were carried out using Human miFinder miScript miRNA PCR array kit by RT-qPCR. Red open circles indicate each miRNA expression, upregulated miRNA (> 2-fold) as red and downregulated miRNA (<-1.8-fold) as green open circles. A. Scatterplot (Upper Panel) represents results from miRNA profiles showing differentially expressed miRNAs in the endometrial cancer tissue derived from the “responder” group compared to normal tissue. List of miRNAs and the fold changes are presented in the lower panels. B. Scatter plot in the upper panel shows the differential expression of miRNAs between the endometrial cancer tissue from recurrent/non-responder group and normal tissue. Lower panels list the differentially expressed miRNAs and the associated fold changes. Statistically significant difference in the fold changes are indicated by p-values: * - <0.05; ** - <0.01; *** - <0.001.

