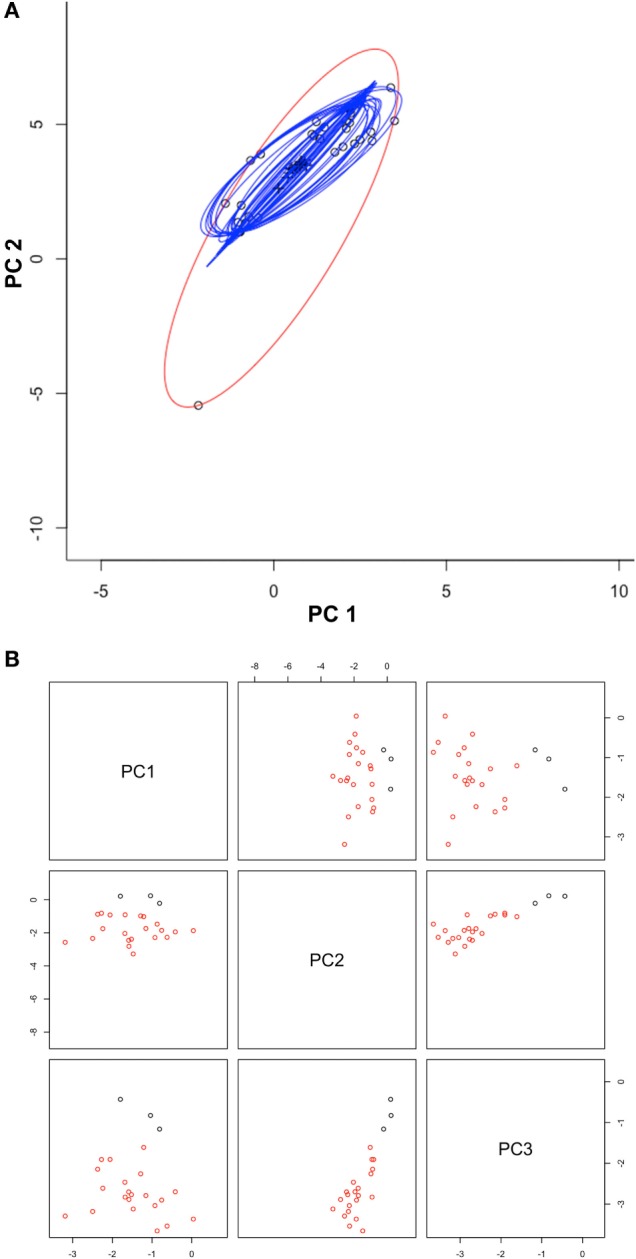
Figure 3.

Automated occurrences curation process. (A) Occurrences (black circles) were displayed in a two-dimensional environmental space of principal components one (PC1) and two (PC2) from the original climate data. Ellipsoids were estimated using the full occurrences (red ellipsoid) and then reducing one occurrence at a time (blue ellipsoids), to filter occurrences via outlier elimination. Note that using 100% of the points resulted in the detection of an outlier (black circle in edge of the red ellipsoid). (B) The first three PC from MODIS data were used to display the distribution of filtered occurrences (red circles) and also occurrences detected clusters (black circles). Note that outlier occurrences in term of climate were also outliers in terms of MODIS data (black points). The script for outlier detection is included as Supplementary Material S1.
