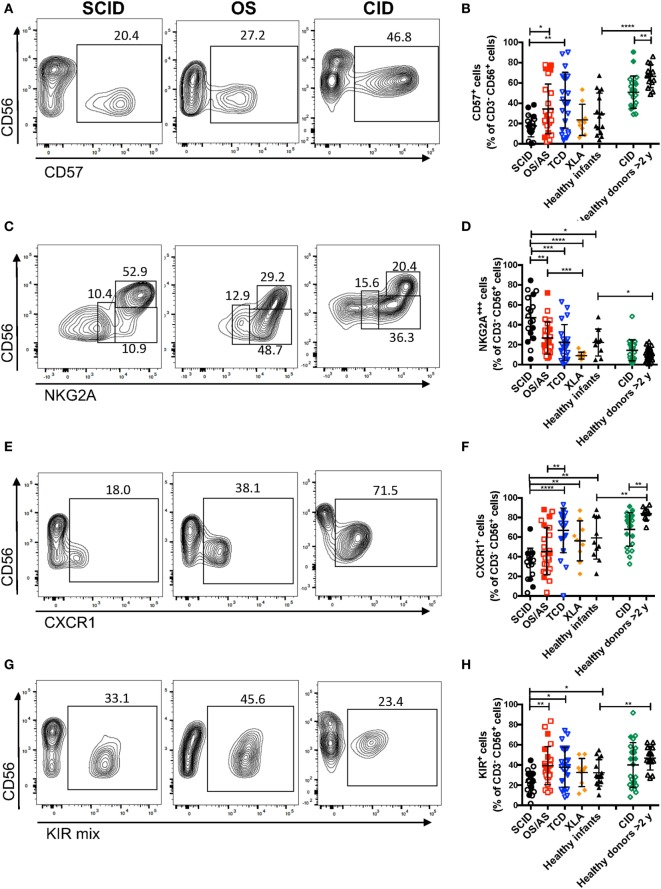
Figure 5.
Flow cytometry analysis of the expression of CD57 (A,B), NKG2A (C,D), and CXCR1 (E,F), and killer cell immunoglobulin-like receptors (KIRs) (G,H) among CD3− CD19− CD14− CD56+ cells. In panels (A,C,E,G), representative examples are shown for one patient each belonging to the severe combined immune deficiency (SCID), Omenn syndrome (OS), and delayed-onset combined immune deficiency (CID) subgroups. For each marker, positivity was defined as fluorescence intensity above that of isotype control. Bars represent mean ± SD values. *p < 0.05; **p < 0.01; ***p < 0.005; ****p < 0.001.

