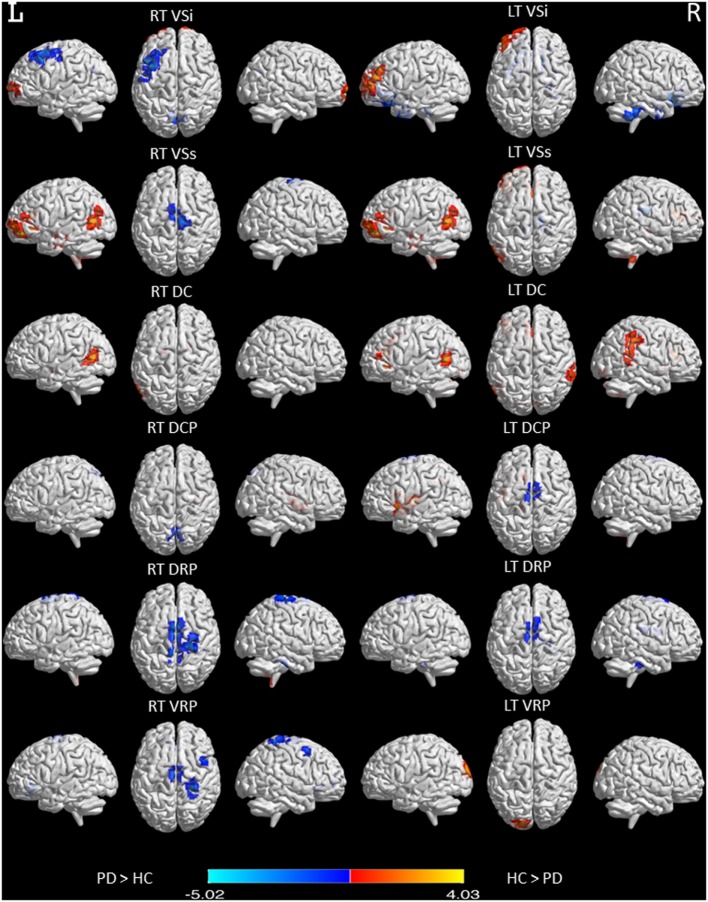
Figure 2.
Functional connectivity differences in six striatal subregions between PD and normal control (NC) participants. Maps showing significant functional connectivity differences in six striatal subregions between the PD and NC participants are rendered on a structural T1 magnetic resonance template. Statistical significance was determined with a voxel-wise Pcorrected < 0.05 based on Monte Carlo simulations. The corrected threshold corresponds to Puncorrected < 0.01 with a minimum cluster size of 40 voxels for multiple comparisons.

