. 2015 Jun 22;6(10):5643–5651. doi: 10.1039/c5sc01693b

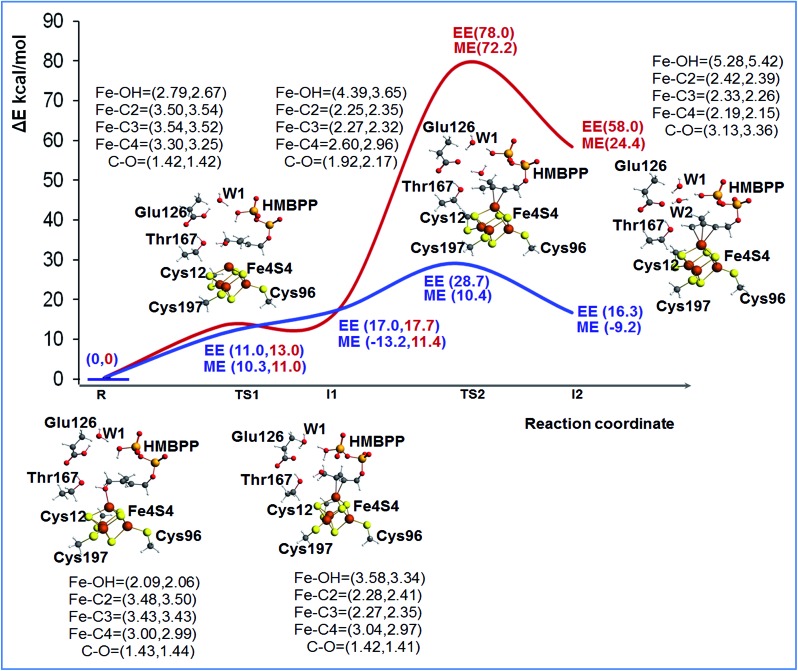
Fig. 2. The ONIOM (B3LYP/TZVP:Amber) reaction profile of the first step in the IspH promoted reactivity, corresponding to rotation and dehydroxylation. The red line corresponds to the case of deprotonated Glu126, while the blue line corresponds to the case of protonated Glu126. ME energies correspond to mechanical embedding with model M1, which is the mode used in the geometry optimization. EE energies correspond to electrostatic embedding evaluated through single point energy calculations with model M2 using geometries from model M1. Stationary points are represented as balls and sticks. Key bond distances are reported in parenthesis, the first value is for the profile of deprotonated Glu126 and the second value is for the profile of protonated Glu126.

Fig. 2