
Fig. 3.
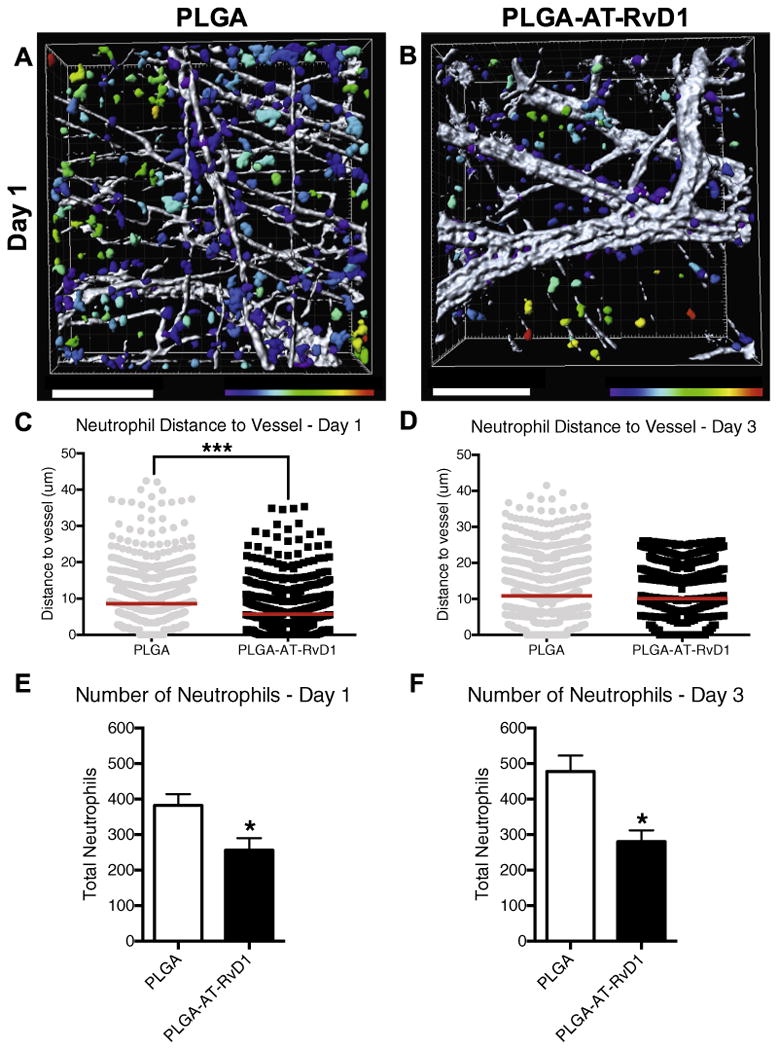
Localized AT-RvD1 delivery limits neutrophil migration through inflamed dorsal tissue. (A-B) Renderings of neutrophil distance from CD31+ vasculature one day after film implantation (representative Imaris renderings of Ly-6G+ cells, color-coded according to distance from the closest CD-31+ blood vessel: purple = 0 μm, red = 30 μm) (C-D) Quantification of neutrophil distance to vessel at post-implant days 1 and 3. Imaris 3-d quantification of neutrophil numbers after (E) one day and (F) three days. Statistical analyses were conducted using two-tailed Mann-Whitney test (C-D) and two-tailed t-test (E-F) *p < 0.05, ***p < 0.001, n > 100 cells, across 3–4 animals per group. Scale bars, 100 mm. (For interpretation of the references to color in this figure legend, the reader is referred to the web version of this article.)