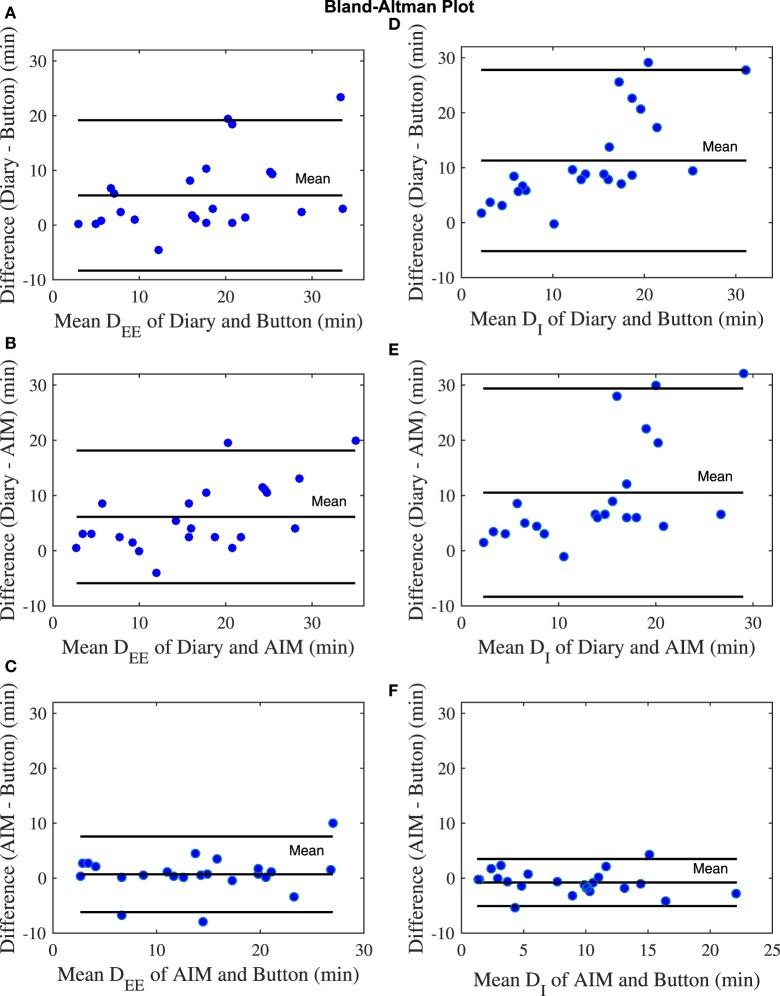
Figure 4.
Bland–Altman plots for number of eating episodes. (A) The eating episode duration (DEE) of diary and button. (B) Duration of ingestion (DI) of diary and button. (C) DEE of diary and automatic ingestion monitor (AIM). (D) DI of diary and AIM. (E) DEE of AIM and button. (F) DI of AIM and button. The blue dots represent eating episodes.

