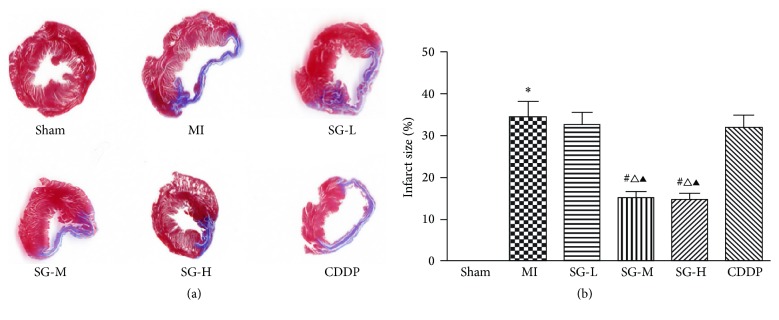
Figure 3.
Infarction size assessment by Masson's trichrome staining. (a) Representative myocardial sections are shown. (b) SG-M and SG-H treatment significantly reduce the infarction size compared with MI group. Each value represents the mean ± SD of nine rats. ∗P < 0.05 versus sham group, #P < 0.05 versus MI group, ∆P < 0.05 versus DSDW group, ▲P < 0.05 versus SG-L group.

