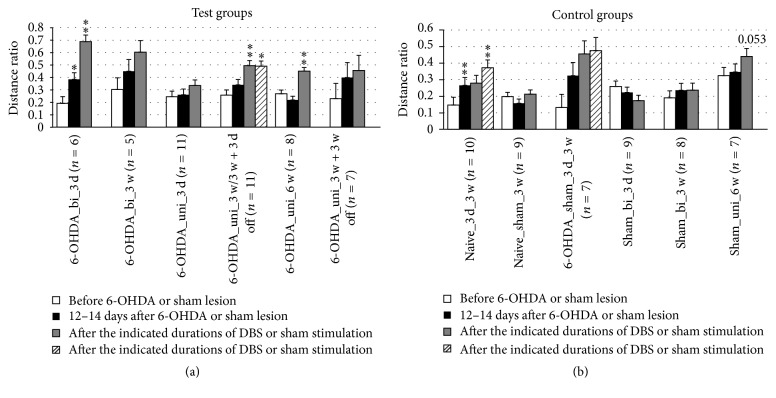
Figure 12.
Short-term and long-term effects of DBS with uni- and bipolar electrodes on the anxiety-like behavior (b) of hemiparkinsonian rats as measured by the ratio: migration distance in the center/total migration in the open field. (a) and (b) refer to test groups and controls, respectively. Different column patterns indicate different times of behavioral testing; white: before 6-OHDA or sham lesion; black: 12–14 days after 6-OHDA or sham lesion; gray and hatched: after the durations of DBS or sham stimulation indicated in the group labels. For experimental details see Table 1. Significance levels are indicated with asterisks as follows: ∗∗p ≤ 0.01, ∗p ≤ 0.05, b (borderline): 0.05 < p ≤ 0.08 according to one-way ANOVA. Asterisks above black columns refer to white columns; all others refer to black columns.

