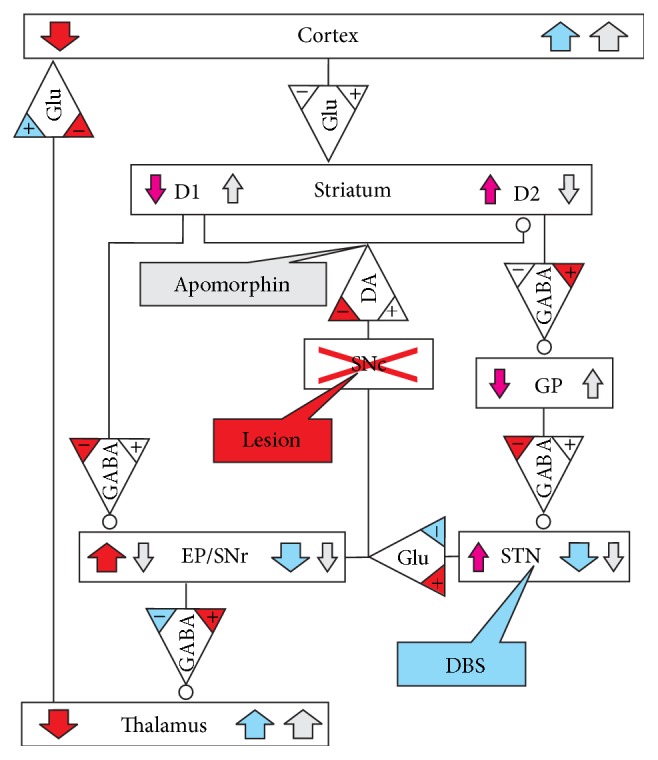
Figure 13.

Simplified scheme of the lesioned hemisphere describing the effects of the lesion (red), DBS (blue), and apomorphine administration (light gray) on neurotransmitter release and on the activity (colored arrows) of different brain areas. Induced alterations in receptor numbers or sensitivities are not depicted; for explanation see Appendix. The brain areas are given in the boxes designated by SNc, GP, STN, and EP/SNr. The neurotransmitters glutamate (Glu), DA, and GABA are designated by triangular boxes pointing toward the affected brain areas that may be either excited (direct line input) or downregulated (input with circle). D1 and D2 stand for the dopaminergic receptors in the striatum, which are excited or inhibited by DA or apomorphine, respectively. Rectangular text balloons mark the input sites of lesioning, DBS, and apomorphine. The colored “+” and “−“ signs in the neurotransmitter triangles designate the effects of lesioning (red) and DBS (blue) on transmitter release. Color-coding was not attempted for the effects of apomorphine on transmitter release.
