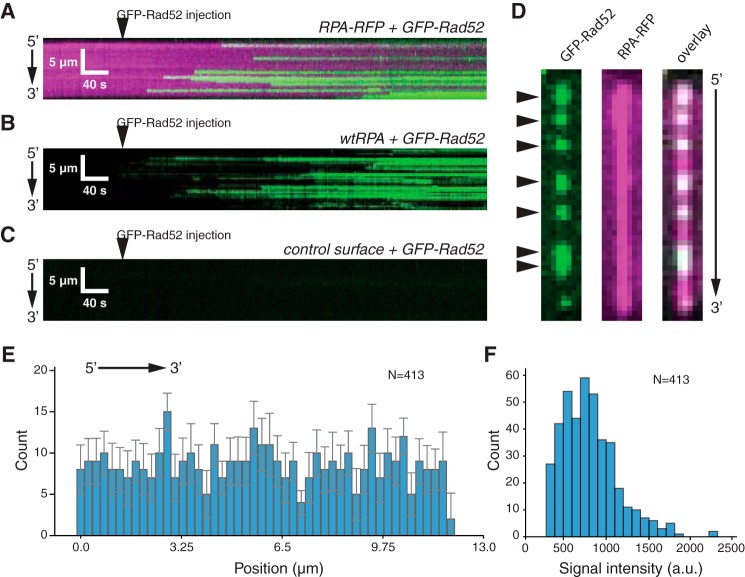
Figure 3.
RAD52-binding behavior. A, kymograph showing real time binding of GFP-RAD52 (50 pm; green) to an RPA-RFP-coated ssDNA molecule (magenta). B, kymograph showing binding of GFP-RAD52 (50 pm; green) to a wtRFP-coated ssDNA molecule (unlabeled). C, kymograph showing that GFP-RAD52 (50 pm; green) does not bind to a control surface within the sample chamber that lacks an ssDNA molecule. D, wide-field images of a single ssDNA molecule showing GFP-RAD52 complexes (green; highlighted with arrowheads), the RPA-RFP-coated ssDNA (magenta), and an overlaid image of the GFP-RAD52 and RFP-RFP signals. E, binding site distribution of GFP-RAD52 bound to the RPA-coated ssDNA molecules. Error bars represent standard deviation obtained through Bootstrap analysis of the data. F, histogram showing the intensity distribution of the RAD52-GFP complexes.

