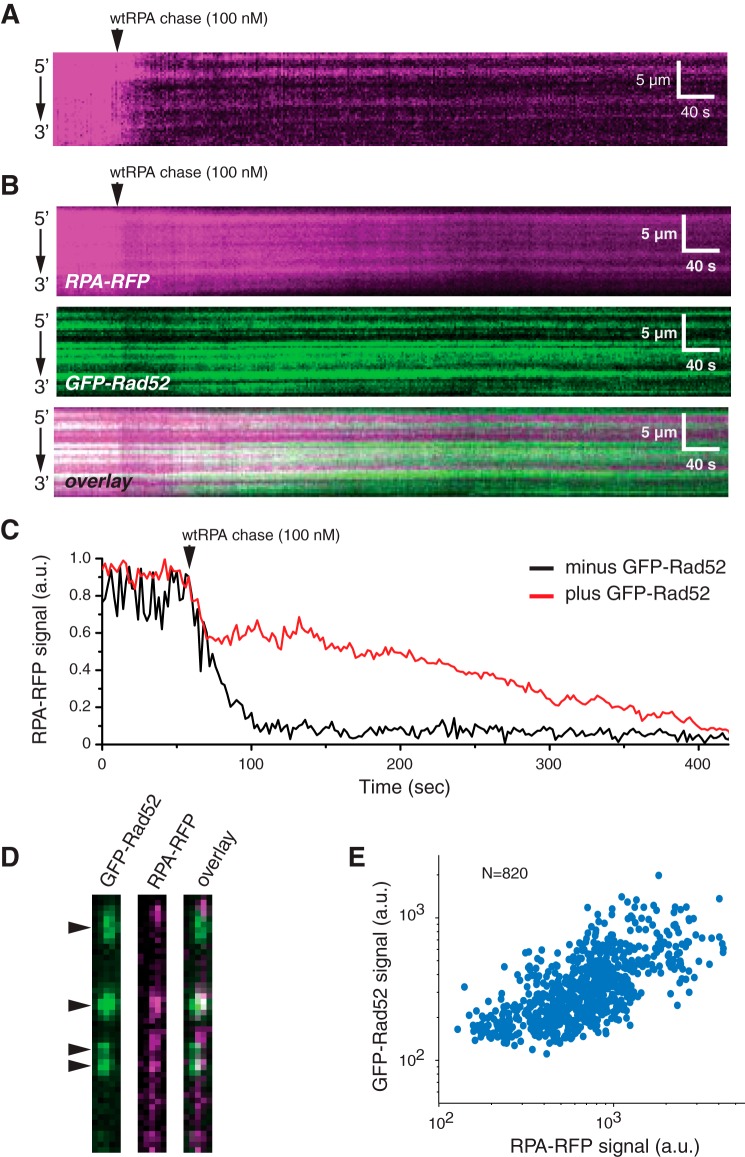
Figure 5.
RAD52 regulation of RPA turnover. A and B, kymograms showing RPA-RFP (magenta) turnover in the absence (A) and presence (B) of GFP-RAD52 (green). C, time-dependent changes in total integrated RPA-RFP fluorescence signal integrated over an entire ssDNA molecule in the presence and absence of GFP-RAD52 (green), as indicated, after chasing with 100 nm wtRPA. D, examples of side-by-side wide-field images showing the co-localization of GFP-RAD52 (green) and turnover-resistant RPA-RFP (magenta) after chasing with 100 nm wtRPA. E, scatter plot showing the correlation between the bound GFP-RAD52 and the turnover-resistant RPA-RFP.

