Figure 6.

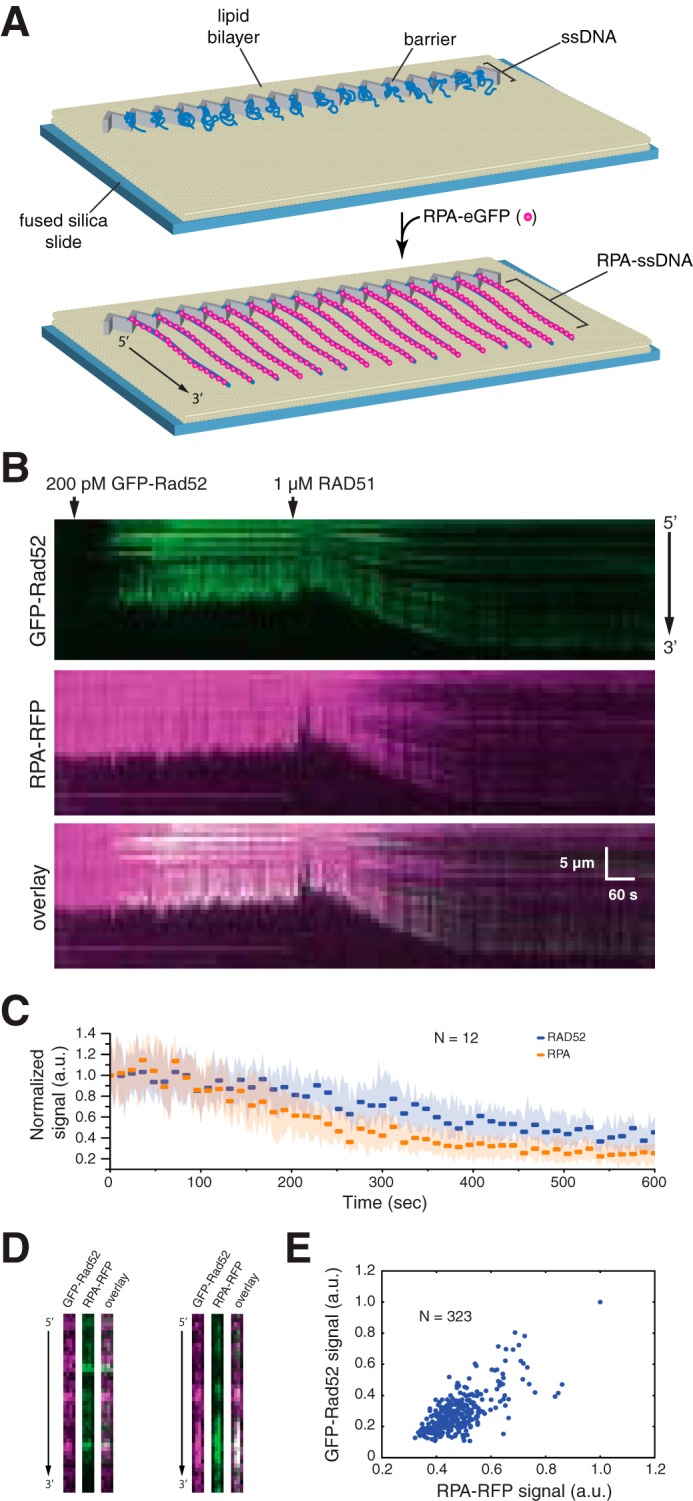
RAD52 and RPA behavior during presynaptic complex assembly. A, schematic illustration of the single-tethered ssDNA curtain assay. B, kymograms showing the binding of GFP-RAD52 (200 pm; green) to an RPA-RFP-ssDNA molecule (magenta), followed by the addition of 1 μm wild-type RAD51 (unlabeled). RAD51 binding coincides with a loss of GFP-RAD52 and RPA-RFP fluorescence signal that also coincides with extension of the ssDNA. C, graphic representation of the GFP-RAD52 and RPA-RFP fluorescence signal loss during presynaptic complex assembly. Each data point reflects the mean integrated signal intensity from entire ssDNA molecules (N = 12 molecules), and error bars represent standard deviation. D, side-by-side presentation of wide-field images of GFP-RAD52 (green) and RPA-RFP (magenta) showing co-localization of RAD52 and RPA clusters embedded within the presynaptic complex. E, scatter plot showing the correlation between GFP-RAD52- and RPA-RFP-binding distributions (based upon the normalized signal intensities) within the presynaptic complex.
