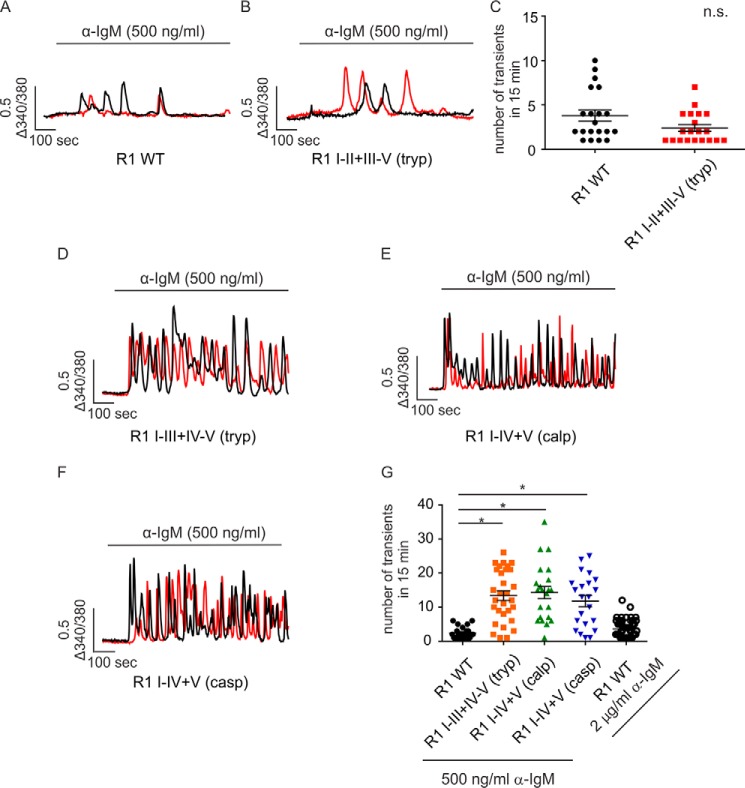
Figure 3.
Fragmentation pattern determines the temporal Ca2+ release profile of the complementary receptor fragments. A–F, DT40-3KO cells stably expressing IP3R1 WT (A), IP3R1 I-II+III-V (tryp) (B), IP3R1 I-III+IV-V (tryp) (D), IP3R1 I-IV+V (calp) (E), or IP3R1 I-IV+V (casp) (F) were loaded with 2 μm Fura-2/AM, followed by cross-linking the B cell receptor using α-IgM (500 ng/ml). Two representative Ca2+ traces are shown for each pair of complementary receptor fragments. The numbers of Ca2+ transients in 15 min of experiments were calculated. C and G, scatterplots indicate that a cleavage site in solvent-exposed region II has no effect on the temporal Ca2+ release profile (C, Student's t test), whereas fragmentation sites more toward to the C terminus significantly increase the number of Ca2+ transients mediated by complementary receptor fragments (G, one-way ANOVA followed by Dunnett post-test). *, statistical significance determined by Dunnett post-test; n.s., not significant. Ca2+ imaging assays were repeated seven times, with more than 40 cells in each experimental run for each set of complementary receptor fragments.

