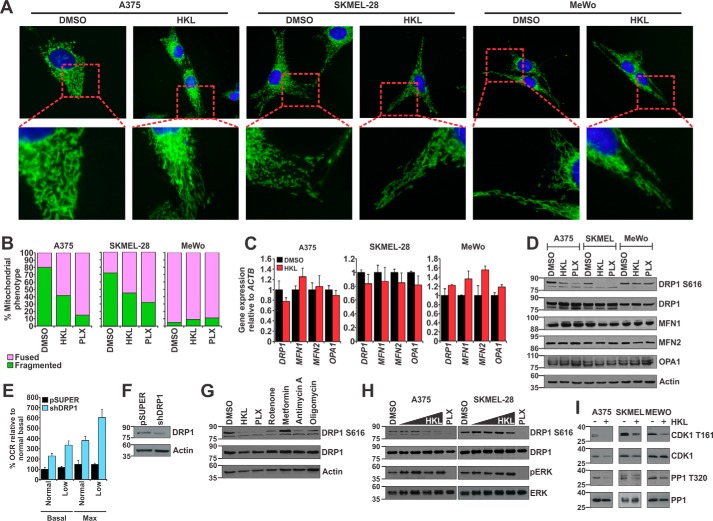
Figure 3.
HKL caused mitochondrial fusion by down-regulating CDK1-mediated DRP1 phosphorylation at serine 616. A, melanoma cells were treated with DMSO or HKL (40 μm) for 24 h. Cells were loaded with MitoTracker Green and Hoechst 33342 (nuclei) and imaged. B, quantification of mitochondrial phenotypes in A375, SKMEL-28, and MeWo cells. In each treatment group 200 cells were counted and scored as containing either fused or fragmented mitochondria. C, quantitative real-time PCR analysis of mitochondrial dynamics genes from melanoma cells treated with DMSO or HKL (40 μm) for 24 h. Gene expression was normalized to ACTB. D, Western blot analysis of mitochondrial dynamics proteins from melanoma cells treated with DMSO, HKL (40 μm), or PLX-4032 (1 μm) for 24 h. β-Actin was used as a loading control. E, SKMEL-28 shDRP1 (or pSUPER) cells were analyzed for basal and maximal OCR in the presence of normal (35 mm) or low (5 mm) glucose. F, Western blot analysis of DRP1 protein levels in control pSUPER or shDRP1 SKMEL-28 cells. β-Actin was used as a loading control. G, A375 cells were treated with DMSO, HKL (40 μm), or 1 μm concentrations of either PLX-4032, rotenone, metformin, antimycin A, or oligomycin for 24 h. Protein lysates were analyzed by Western blot for phosphorylated DRP1 (DRP1 S616) and total DRP1. β-Actin was used as a loading control. H, A375 and SKMEL-28 cells were treated with DMSO, increasing doses (10, 20, 30, or 40 μm) HKL, or PLX-4032 (1 μm) for 24 h. Protein lysates were analyzed by Western blot for pDRP1 S616, total DRP1, phosphorylated ERK (pERK), and total ERK. I, melanoma cells were treated with DMSO or HKL (40 μm) for 24 h. Protein lysates were analyzed by Western blot for phosphorylated CDK1 (CDK1 T161), total CDK1, phosphorylated PP1 (PP1 T320), and total PP1. All data are representative of at least three independent experiments and are reported as the mean ± S.E.

