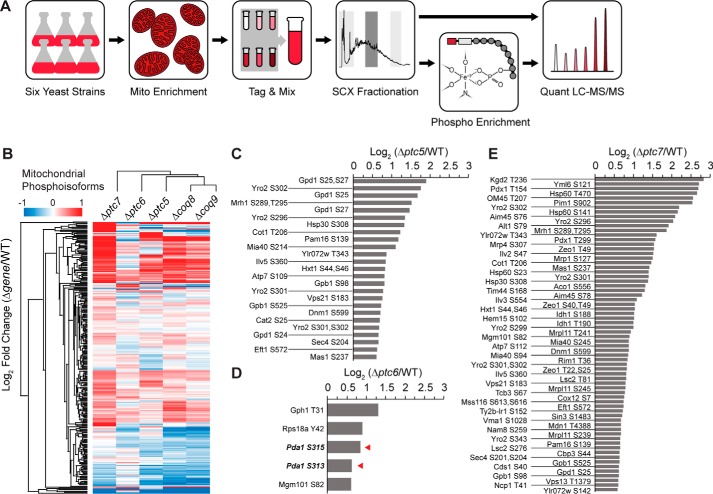
Figure 3.
Comparative mitochondrial phosphoproteomic analyses of Δptc yeast strains. A, experimental phosphoproteomics workflow. Crude mitochondria from six yeast strains (WT, Δptc5, Δptc6, Δptc7, Δcoq8, and Δcoq9) were used. Peptides were tagged with 6-plex TMT for MS-based quantification. The red and white boxes in the Phospho Enrichment panel represent the reporter and balancing groups of the TMT, respectively. B, hierarchical clusters of Δgene yeast strains and all quantified mitochondrial phosphoisoforms. C–E, fold changes of mitochondrial phosphoisoforms with values larger than 1.5 (log2 (Δgene/WT)) from Δptc5 (C), Δptc6 (D), and Δptc7 (E). The red arrowheads in D denote Pda1p phosphoisoforms.

