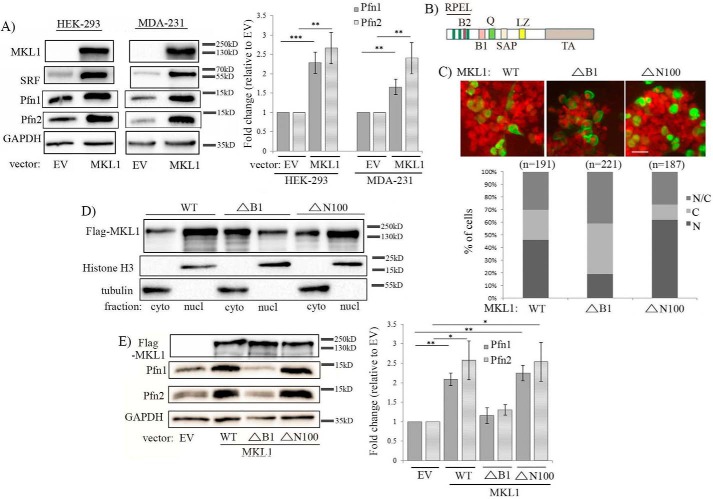
Figure 2.
Effect of MKL1 overexpression on Pfn expression. A, immunoblot analyses of MKL1, SRF, Pfn1, and Pfn2 expression 48 h after transfection with either empty vector (EV) or FLAG-tagged wild-type (WT) MKL1 in HEK-293 and MDA-231 cells (images of MKL1 bands were acquired at a very low exposure (0.05 s) to prevent saturation of the MKL1 overexpression lane signal, which prevented the endogenous MKL1 band from being detected). B, schematic of MKL structure (RPEL, three actin-binding regions that also has basic rich B2 region containing nuclear localization signal); B1, basic region that has a second nuclear localization signal and SRF-binding site; Q, glutamine-rich domain; SAP, DNA-binding domain; LZ, leucine zipper (dimerization) domain; TA, transcriptional activation domain). C, HEK-293 cells expressing various FLAG-tagged MKL1 constructs (WT, ΔN100 (lacks the first 100 amino acids), ΔB1 (internal deletion of amino acids 222–237)) were immunostained with anti-FLAG (green) antibody and DAPI (red) and scored for % cells for subcellular localization of FLAG-MKL1 as summarized in the graph below (N, exclusively nuclear; C, exclusively cytoplasmic; N/C, localized in both cytoplasmic and nuclear compartments; n indicates the number of cells analyzed in each group). D, anti-FLAG immunoblot analyses of nuclear (nucl) versus cytoplasmic (cyto) fractions prepared from HEK-293 cells 48 h after transfection with the indicated FLAG-tagged MKL constructs. Histone-H3 and tubulin blots serve as loading controls for nuclear and cytoplasmic fractions, respectively. E, total extracts of HEK-293 cells transfected with the above constructs were analyzed by immunoblotting for expression of Pfn1, Pfn2, and GAPDH (loading control); the anti-FLAG blot shows comparable expression levels of the various MKL1 constructs. The bar graph shows the average ± S.D. of the fold-changes in Pfn expression with respect to the corresponding control transfection condition (data summarized from three experiments; **, p < 0.01; *, p < 0.05). The electrophoretic mobility shift of ΔN100-MKL1 was not apparent in this blot as these samples were run on a high percentage (15%) gel.

