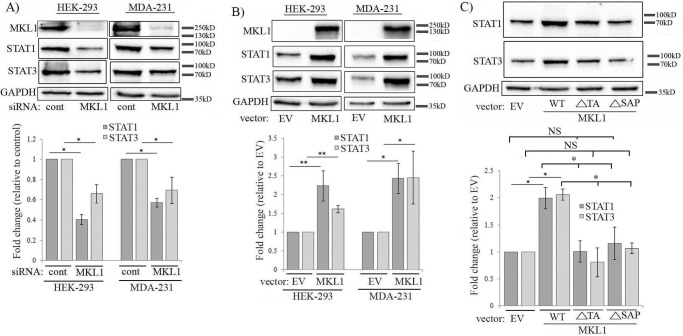
Figure 4.
MKL promotes the expression of STAT isoforms through its SAP domain function. A and B, immunoblot analyses of HEK-293 and MDA-231 extracts showing the effects of either knockdown (A) or overexpression (B) of MKL1 on STAT1 and STAT3 expression (lysates were prepared 72 and 48 h after siRNA and plasmid transfections, respectively). The bar graphs show the mean ± S.D. values of fold-changes in STAT isoforms associated with MKL1 perturbations. C, STAT1 and STAT3 immunoblot analyses of HEK-293 extracts following overexpression of either WT form or the indicated deletion mutants of MKL1. The bar graphs show the mean ± S.D. values of the fold-changes in STAT1 and STAT3 expression with respect to the corresponding control transfection condition. All data are summarized from three experiments (**, p < 0.01; *, p < 0.05, NS, not significant; EV, empty vector). GAPDH blots serve as the loading control.

