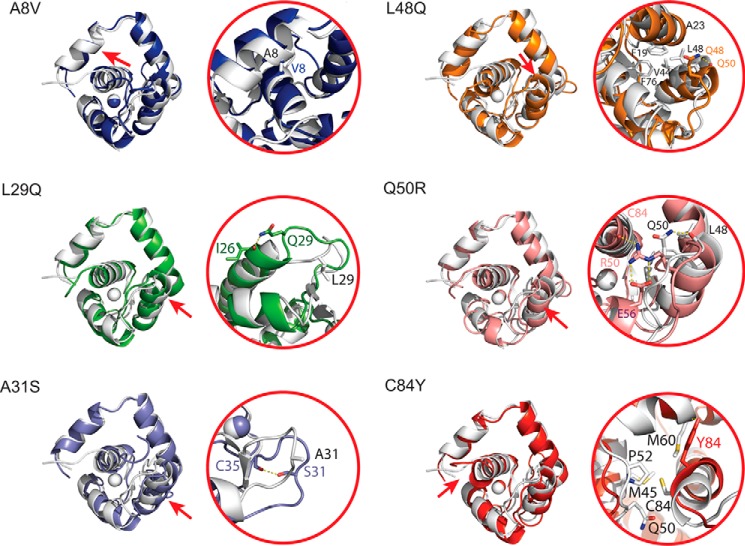
Figure 3.
Structural changes induced by each of the mutations. In each panel, the left side contains a representative structure of each mutation superimposed with the wild-type structure (white). To orient the reader, a red arrow indicates the location of the mutation on the structure. Changes to side chain packing in the immediate area of each mutation are demonstrated on the right for each of the mutations. Although the changes to the backbone are very subtle, there are side chain rearrangements in the local vicinity of the mutations, particularly for the mutations that occur at helix–helix interfaces such as A8V, L48Q, and Q50R.

