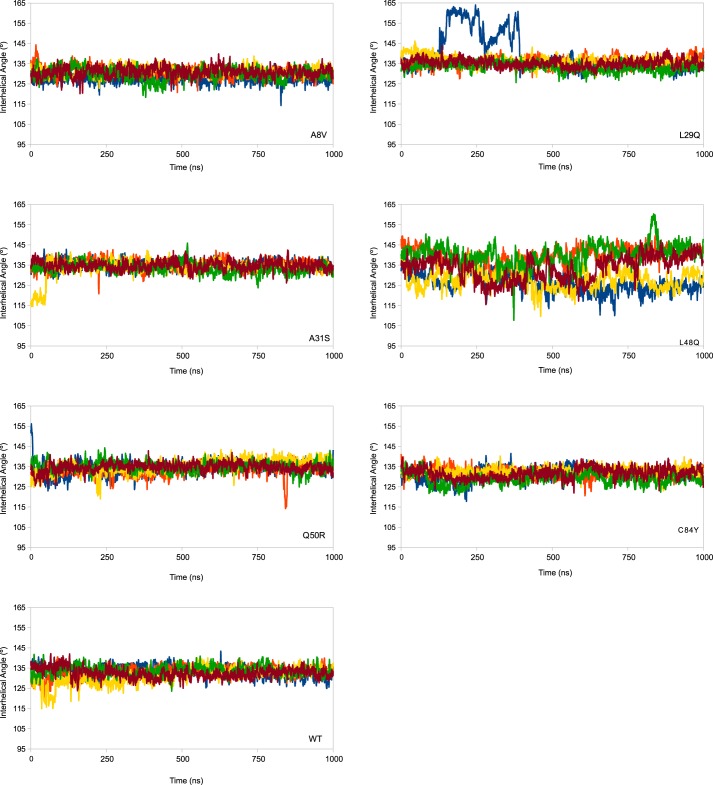
Figure 4.
The A/B interhelical angle is plotted as a function of time for five replicated simulations of each mutated model. Plots are a rolling average of 250 ps. An interhelical angle less than 110° is considered open, and above 130° is considered closed. There is little difference between WT and most of the constructs, with the exception of the L48Q model. The large angle values in one replicate of the L29Q simulations is an artifact caused by a transient loss and recovery of secondary structure in one of the replicated simulations; the hydrophobic solvent-accessible surface is not increased as a function of this change. The h-sasa as a function of time is reported in supplemental Fig. S4.

