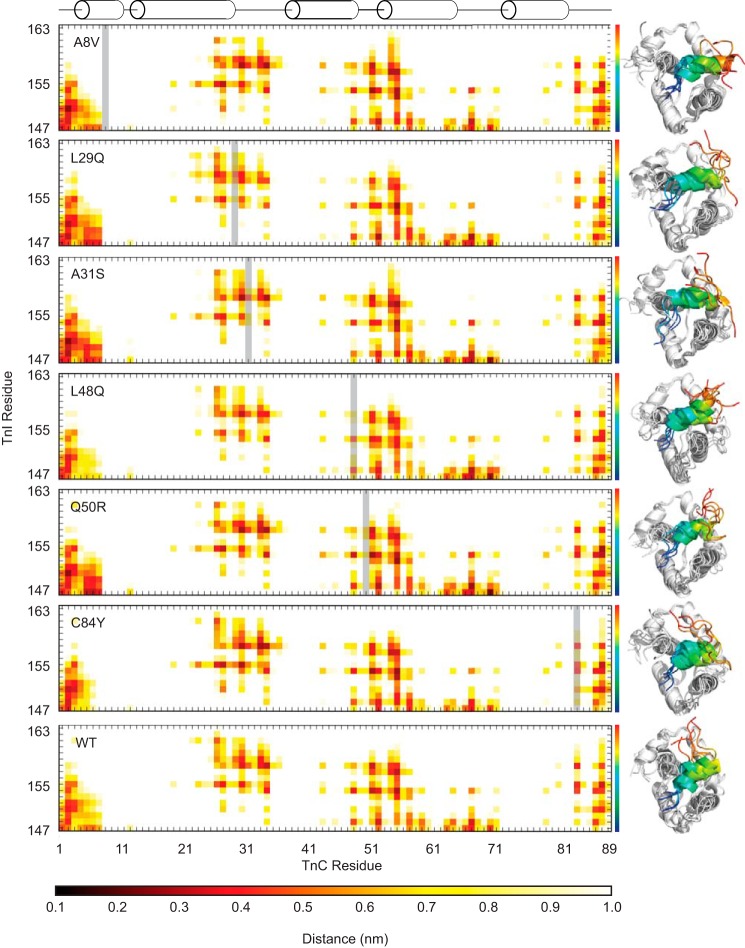
Figure 6.
Average distance between cTnC and cTnI residues. The mutated TnC residue in each plot is indicated by a gray bar. The structures to the right are representative structures of independent simulations and indicate the differences in the orientation and variability of the cTnISW peptide across replicates for each mutant. The TnISW is colored as a spectrum from blue at the N terminus to red at the C terminus. The calculated ΔG of interaction is maintained across mutations despite differences in the interaction distance profiles, which suggests a nonspecific interaction. The A31S mutant has a ΔG of interaction with the TnISW ∼25% lower than WT (Table 2), perhaps because of shorter interaction distances with the N-terminal region of N-cTnC but longer interaction distances in the vicinity of the A31S mutation and C-terminal portion of the TnISW.

