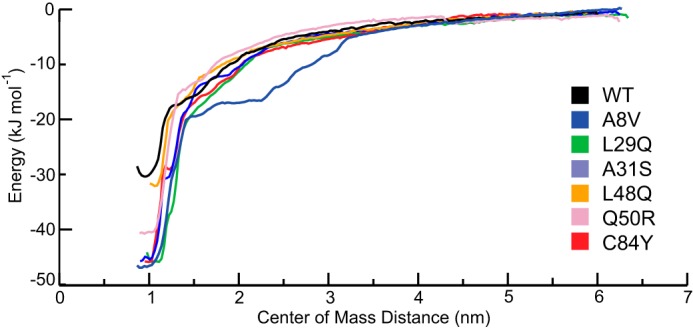
Figure 7.

The potential of mean force profile of each of the mutated constructs as a function of center of mass distance between the TnC molecule and Ca2+ ion. Each of the mutated constructs has an increased ΔG of Ca2+ interaction. L48Q (−32 ± 3 kJ·mol−1) is the closest to WT (−32 ± 4 kJ·mol−1), followed by Q50R (−41.3 ± 3 kJ·mol−1), L29Q (−46 ± 2 kJ·mol−1), C84Y (−46 ± 3 kJ·mol−1) A31S (−46 ± 2 kJ·mol−1), and A8V (−46 ± 5 kJ·mol−1), which are similar to each other.
