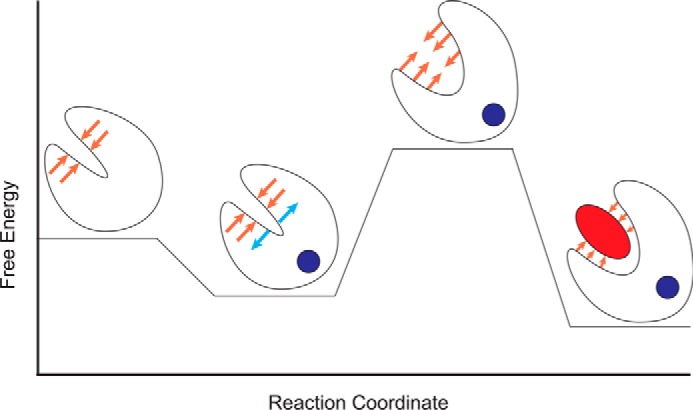
Figure 8.

Schematic of the energetic landscape of N-cTnC activation. N-cTnC is shown as a cartoon. Ca2+ is a blue circle, and the TnI switch peptide is represented as a red ellipse. Lower energy states are more favorable. The orange arrows represent the resistance to the conformational change caused by the hydrophobic cleft. The blue arrows indicate conformational strain introduced by Ca2+ binding. The Ca2+-bound, open conformation relieves the conformational strain while occluding the hydrophobic cleft and is therefore the most favorable conformation. Mutations that affect the relative stabilities of these states will modify the probability of transitions between them and increase or decrease the Ca2+ sensitivity of the myofilament.
