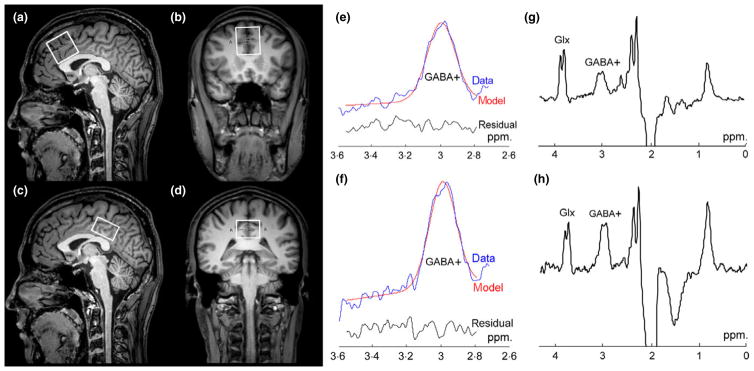
Fig. 1.
MRS voxel placement and representative spectra. T1-weighted TFE images show single-voxel placements centred on the median prefrontal cortex (mPFC) in the sagittal (a) and coronal (b) projections and on the posterior cingulate cortex (PCC) in the sagittal (c) and coronal (d) projections. (e, f) Curve-fitting of the GABA+ peaks of the mPFC and PCC; the red lines in the panels are the results of the GannetFit curve-fitting, the blue lines show the processed GABA+ spectra and the black line is the residual difference between the experimental data and the curve-fit. (g, h) Representative GABA+ spectra.

