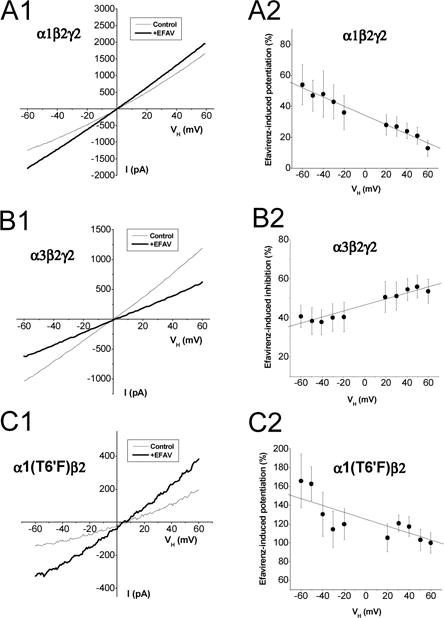
Figure 8. Current-voltage relationship for efavirenz effect on GABAA receptors.

Whole-cell currents were recorded from single cells expressing α1β2γ2 (A), α3β2γ2 (B) or α1(T6′F)β2 receptors (C). Efavirenz (10 μM) was co-applied with EC30 GABA [10 μM for α1β2γ2, 20 μM for α3β2γ2 and 1 μM for α1(T6′F)β2]. A1&B1&C1, Average current response to a voltage ramp from −60 to +60 mV (0.24 mV/ms) at control and during efavirenz application. A2&B2&C2, Voltage-dependence of efavirenz effect on GABA currents. The currents are normalized to the control response at the same holding potential (VH). Solid line shows fit the mean of efavirenz-induced effect with a linear regression. α1β2γ2: n=5; α3β2γ2: n=9; α1(T6′F)β2: n=6.
