
Figure 1.
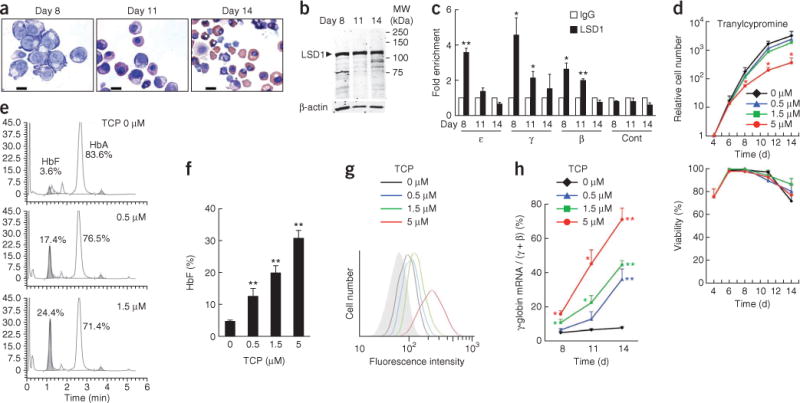
Induction of fetal hemoglobin by an LSD1 inhibitor, TCP, in adult erythroid cells. (a) Morphology of primary human erythroid cells differentiated ex vivo from CD34+ progenitor cells at the indicated times of cell culture. Scale bars, 10 μm. (b) Immunoblot showing LSD1 and β-actin (loading control) abundance in differentiating human erythroid cells. (c) ChIP assay examining LSD1 binding to the gene promoters of embryonic ε-, fetal γ- and adult β-globins after 8, 11 or 14 d of differentiation from CD34+ cells. The abundance of DNA precipitated with an LSD1-specific antibody was normalized to that precipitated with control IgG. As a negative control (Cont), an intergenic region between the ε- and Gγ-globin–encoding genes was used. n = 2 independent immunoprecipitations. (d) Proliferation and viability of differentiating erythroid cells exposed to the indicated concentrations of TCP. n = 3 independent experiments. (e) Representative HPLC chromatograms showing HbF abundance (shaded area) in TCP-treated and untreated human erythroid cells 14 d after differentiation induction. Numbers indicate the percentages of HbF and HbA in total hemoglobin. The y axis represents the abundance of hemoglobin in the elution in an arbitrary unit. (f) Average HbF percentages in total hemoglobin, determined by HPLC, in TCP-treated and untreated human erythroid cells on day 14. n = 3–5 independent experiments. (g) Flow-cytometric analysis of HbF synthesis in TCP-treated and untreated cells on day 14 (colored lines). The shaded area indicates staining with control IgG. (h) Relative γ-globin mRNA abundance normalized to total β-type globin mRNAs (fetal γ- plus adult β-globin) in TCP-treated and untreated cells. n = 3 independent experiments. Statistically significant differences between the LSD1-specific antibody and control IgG (c) or between TCP-treated and untreated cells (d,f,h) are indicated (*P < 0.05; **P < 0.01). Error bars represent s.e.m.