
Figure 2.
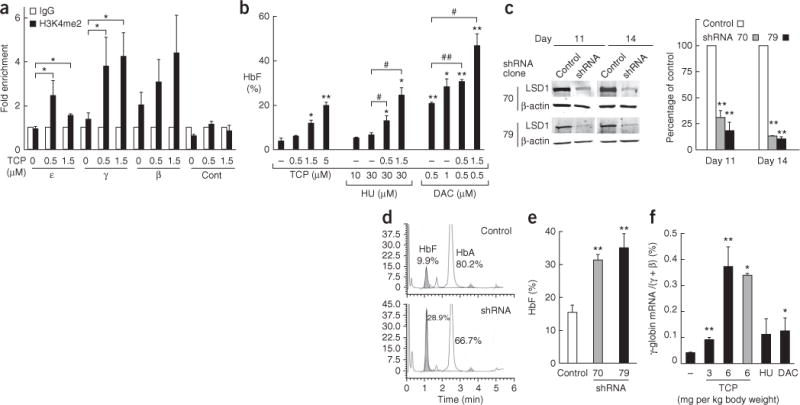
Induction of γ-globin expression by LSD1 inhibition. (a) ChIP assay showing H3K4me2 accumulation induced by TCP on the fetal γ-globin promoter on day 11 of human CD34+ cell differentiation. The abundance of DNA precipitated with an H3K4me2-specific antibody is normalized to that precipitated with control IgG. A negative control (Cont) was used as in Figure 1c. n = 4 independent immunoprecipitations. (b) Effects of TCP, hydroxyurea (HU) and decitabine (DAC) either as single agents or in combination on HbF synthesis, as examined in differentiating human erythroid cells. HbF was measured by HPLC on day 14. Statistically significant differences between cells treated with hydroxyurea or decitabine alone and cells treated additionally with TCP are indicated (#P < 0.05; ##P < 0.01). n = 2 independent experiments. (c) Immunoblots showing LSD1 and β-actin (internal control) in shRNA virus–or control virus–infected cells. Two different shRNA clones (70 and 79) targeting different segments of LSD1 mRNA were used. The bar graph shows the relative abundance of LSD1 normalized to β-actin and to control cells. n = 3 independent experiments. (d) HPLC chromatograms showing HbF abundance in LSD1 shRNA (clone 70) virus–or control virus–infected cells. The y axis represents the abundance of hemoglobin in the elution in an arbitrary unit. (e) Average HbF abundance, determined by HPLC, in LSD1 shRNA virus–or control virus–infected cells. (f) γ-globin mRNA abundance, normalized to total β-type globin mRNAs, in bone marrow cells of β-YAC mice injected with TCP at 3 or 6 mg per kg body weight per day or saline 5 d a week for 4 weeks. A subset of mice injected with TCP (6 mg per kg body weight) for 4 weeks were analyzed 18 d after cessation of drug administration (gray bar). For comparison, mice were treated with hydroxyurea (200 mg per kg body weight per day, 5 d a week for 4 weeks) or decitabine (5 mg per kg body weight per day for 5 d) to examine their individual inductive effects14,15. n = 6 mice for the control group, n = 3 mice for the TCP 3 mg per kg body weight group, n = 4 mice for all other groups. Statistically significant differences between drug-treated and untreated cells (a,b), between shRNA virus–and control virus–infected cells (c,e), or between drug-injected and control mice (f) are indicated (*P < 0.05; **P < 0.01). Error bars represent s.e.m.