Figure 2.

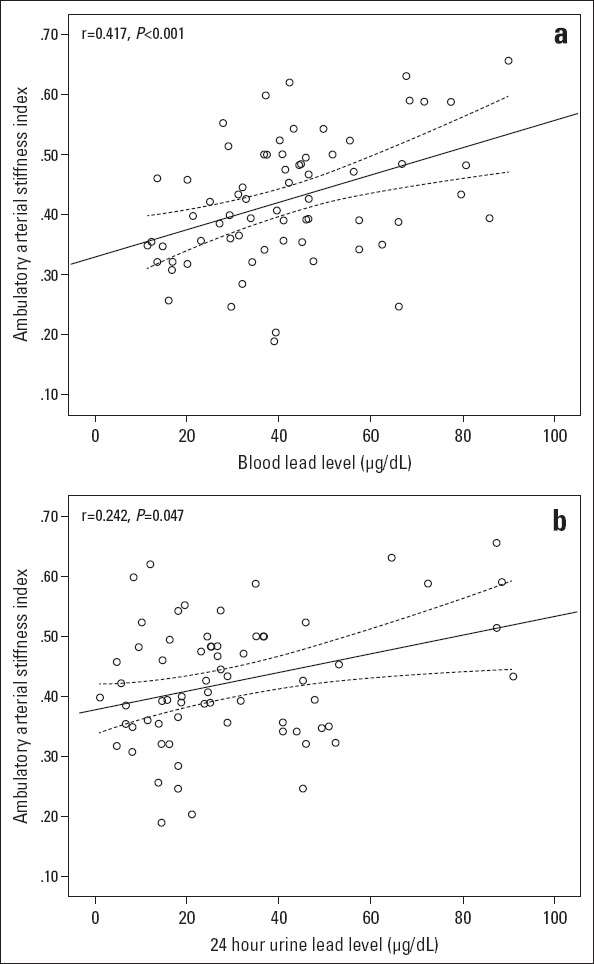
Correlation graphics between the ambulatory arterial stiffness index and blood lead (a) and (b) 24-hour urine lead level in the lead-exposed group. The dotted line represents a 95% confidence interval level in the lead-exposed group

Correlation graphics between the ambulatory arterial stiffness index and blood lead (a) and (b) 24-hour urine lead level in the lead-exposed group. The dotted line represents a 95% confidence interval level in the lead-exposed group