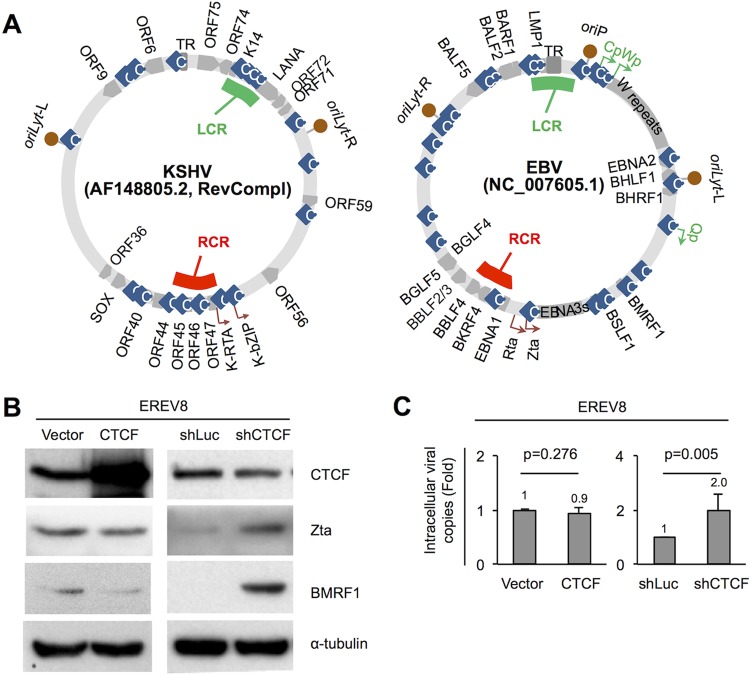
FIG 6.
CTCF represses viral lytic cycle replication in EREV8 cells. (A, left) Sequences of KSHV strain AF148805.2 (137,969 bp) and EBV strain NC_007605.1 (171,823 bp) were retrieved from NCBI, followed by manual alignment and annotation using SnapGene Viewer (GSL Biotech LLC, IL). Functional orthologs of KSHV and EBV were found to be located at similar positions of the maps, including (clockwise) TR|TR, oriLyt-R|oriLyt-L, ORF59|BMRF1, ORF56|BSLF1, K-bZIP|Zta, K-RTA|Rta, BKRF4|ORF45, ORF44|BBLF4, ORF40|BBLF2_3, SOX|BGLF5, ORF36|BGLF4, oriLyt-L|oriLyt-R, ORF9|BALF5, and ORF6|BALF2. The latency control region (LCR; green strip) is located at the KSHV LANA promoter and EBV LMP1/LMP2 region, respectively. The lytic reactivation control region (RCR; red strip) is located upstream of KSHV K-RTA and EBV BKRF4, respectively. Information on CTCF binding sites (light-blue rhombi) was adapted from references 23–26, 29, and 83. (B and C) Expression plasmids of vector control (vector), CTCF, shRNA of luciferase (shLuc), and shRNA of CTCF (shCTCF) were transfected into EREV8 cells for 3 days. (B) Protein extracts from cells with CTCF overexpression (48 h) or shRNA of CTCF (72 h) were harvested and subjected to Western blot analysis for CTCF, Zta, and BMRF1 (lytic protein) expression; α-tubulin served as a loading control. (C) Intracellular EBV DNAs collected at 72 h postransduction were quantitated by real-time PCR analysis using the EBV DNA polymerase fragment as the amplification target. Data are presented as the means ± SD from three independent experiments. Statistical evaluations were performed with Student's t test.

