FIG 2.
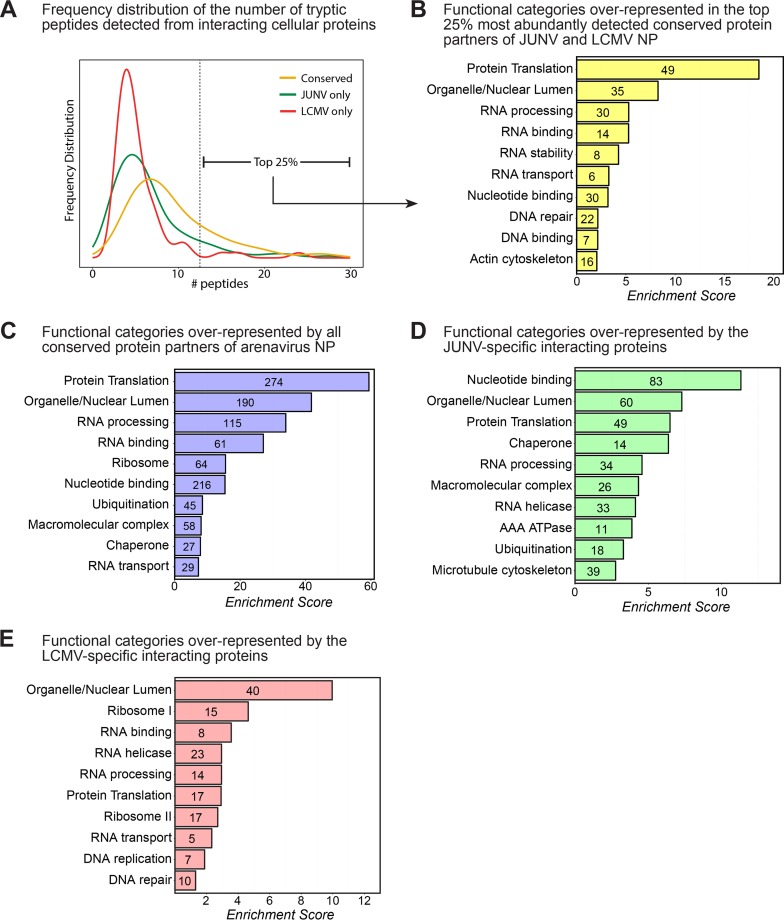
Bioinformatic analysis of host protein partners of arenavirus NPs. (A) Frequency distribution histogram showing the number of individually identified peptides per protein for host proteins interacting with JUNV NP only, LCMV NP only, or both viral NPs (conserved). The vertical dashed line indicates the threshold above which the 25% most abundant conserved interacting proteins were detected. (B) Bioinformatic NIH DAVID functional annotation clustering analysis showing the most highly enriched biological function categories represented in the list of the 25% most abundantly detected and conserved interacting proteins (n = 69) displayed in Table 1. (C) Bioinformatic NIH DAVID functional annotation clustering analysis showing the most highly enriched biological function categories represented in the entire list of interacting proteins (n = 582). (D) NIH DAVID analysis of the subset of proteins displaying specific interactions with only the JUNV NP (n = 234). (E) NIH DAVID analysis of the subset of proteins displaying specific interactions with only the LCMV NP (n = 73). For panels A to E, interacting human proteins that were detected in at least 1 of the 2 independent experiments for JUNV in either A549 or HEK 293T cells and/or 1 of the 2 independent experiments for LCMV in either A549 or HEK 293T cells were used for bioinformatic analysis.

