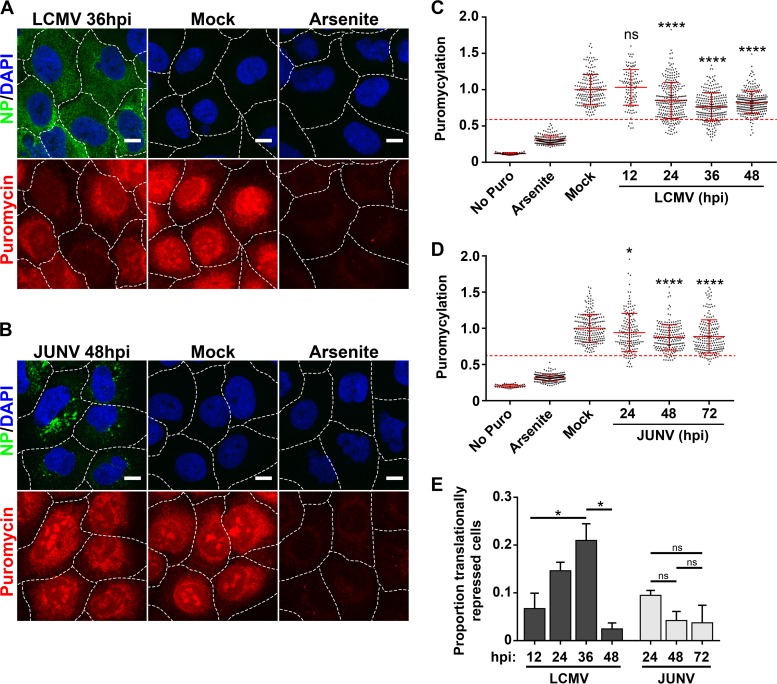
FIG 9.
Translational profiles of cells infected with JUNV or LCMV. (A and B) Cells were either infected with LCMV (n = 2) (A) or JUNV (n = 2) (B), mock infected, or treated with 500 μM sodium arsenite, and rates of translation were assessed by labeling newly synthesized peptides with puromycin. (C and D) Puromycin levels were quantitated for individual cells receiving no puromycin, mock-infected cells labeled with puromycin, mock-infected cells treated with sodium arsenite prior to puromycin labeling, and cells infected with LCMV (C) or JUNV (D) at different time points following infection. The level for each individual cell was normalized to the mean level of puromycylation for mock-infected cells. The puromycin labeling of individual cells is represented by single dots, the mean puromycin labeling is represented by a solid red horizontal line for each condition, and red error bars represent standard deviations (SD) and were compared between the mock group and each time point by one-way ANOVA. A red dashed line representing the threshold for translational repression was set as the mean level of puromycylation in mock-infected cells labeled with puromycin minus (1.96 × SD). (C) n values were as follows: no Puro, n = 44 cells; arsenite, n = 194 cells; mock, n = 191 cells; LCMV 12 h, n = 113 cells; LCMV 24 h, n = 276 cells; LCMV 36 h, n = 260 cells; and LCMV 48 h, n = 269 cells. (D) n values were as follows: no Puro, n = 40 cells; arsenite, n = 205 cells; mock, n = 215 cells; JUNV 24 h, n = 161 cells; JUNV 48 h, n = 198 cells; and JUNV 72 h, n = 205 cells. (E) The proportions of individual cells that fell below the translational repression threshold under each condition were compared by one-way ANOVA. Though all possible comparisons between LCMV-infected cultures at different times postinfection were made for panel E, for clarity, only significant differences are shown. In panels A and B, the borders between adjacent cells are represented by dashed white lines. Bars = 10 μm. ns, not significant (P > 0.05); *, P ≤ 0.05; ****, P ≤ 0.0001.

