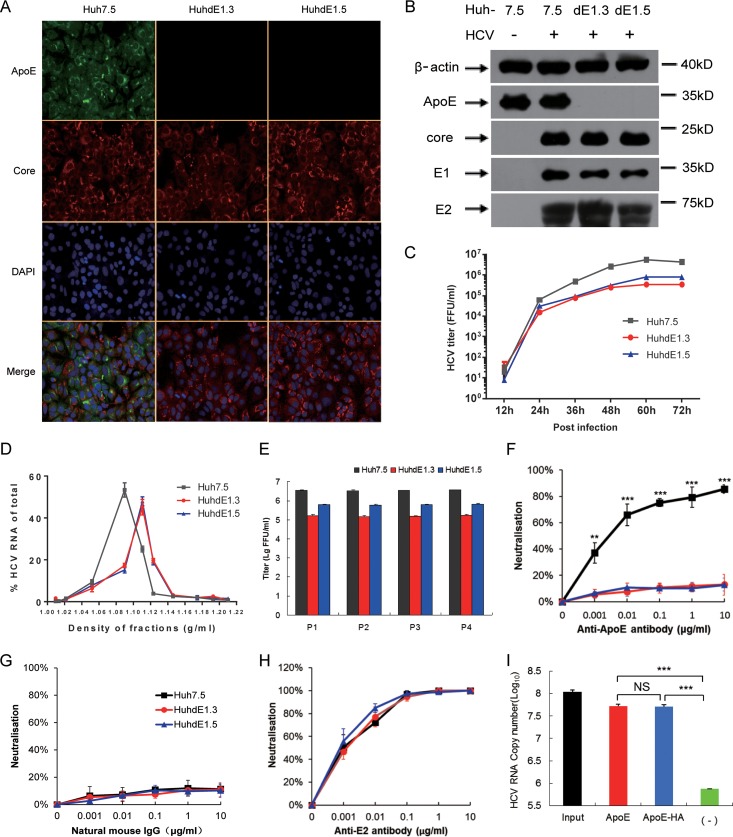
FIG 5.
sApoE bound to HCVcc produced from ApoE knockout cell lines. (A) Immunofluorescence analysis of wild-type and ApoE knockout Huh7.5 cell lines infected with HCVcc. Cell lines (top) were infected by HCVcc, and 48 h later, immunofluorescence analysis was performed using ApoE (green) and HCV core (red) antibodies and 4′,6-diamidino-2-phenylindole (DAPI; blue). Three images were merged in the bottom row. (B) Expression of cellular ApoE and viral proteins analyzed by Western blotting. (C) Huh7.5 and ApoE knockout cell lines were infected with HCVcc (multiplicity of infection [MOI] = 0.01). The supernatants were harvested to quantify virus production by FF-IHC assay. (D) Biophysical properties of HCV particles produced from Huh7.5 and ApoE knockout cell lines. Huh7.5, HuhdE1.3, and HuhdE1.5 cells were infected with HCVcc. After 60 h, the supernatants were concentrated and fractionated by density gradient centrifugation. Twelve fractions were harvested and used for the determination of density and HCV RNA concentration. (E) HCVcc was continuously passaged separately in the Huh7.5, HuhdE1.3, and HuhdE1.5 cell lines. The Huh7.5 and ApoE knockout cell lines were infected with HCVcc (MOI = 0.01). The supernatants were harvested to quantify virus production 60 h postinfection. Virus titers were determined using focus forming assays at the indicated number of passages (P1 to P4) and are shown as the means ± SDs (error bars) pooled from three independent wells. (F to H) HCV produced from the Huh7.5 and ApoE knockout cell lines, HuhdE1.3 and HuhdE1.5, were neutralized by anti-ApoE or anti-E2 antibodies. The natural mouse IgG was used as a control. (I) HCVcc produced by the ApoE knockout cell line HuhdE1.5 was mixed with sApoE or HA-tagged sApoE (sApoE-HA) secreted by 293T cells in cell culture media. The negative control was blank 293T cell culture supernatant. The mixtures were separately captured by ApoE-specific immunoprecipitation. HCV genome copies in the immunocomplexes were quantified using qRT-PCR. The data represent the means ± SDs from three independent experiments. **, P < 0.01; ***, P < 0.001 (unpaired Student's t test). NS, not significant.

