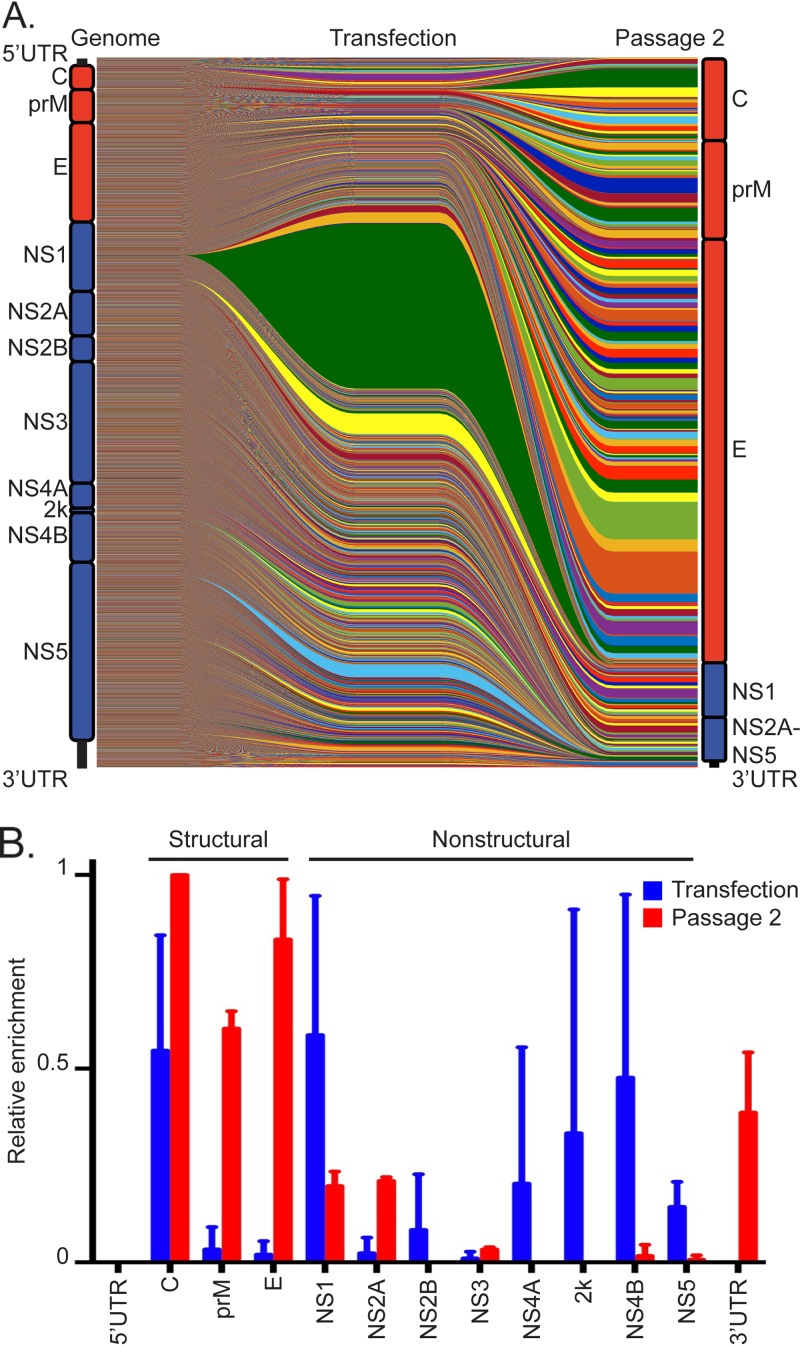
FIG 3.
Tolerance for insertions in the ZIKV genome following library transfection and passaging. (A) Viral mutant progression plots showing the relative abundances of individual insertion sites in cells following transfection and supernatant passage 2. Horizontal colored lines on the left side of the graph (genome portion) denote the location of each insertion in the ZIKV genome illustration, which is drawn to scale on the left. The thicknesses of the lines change in the center and the right of the graph to represent the proportions of each insertional mutant in the transfection and passage 2 cell populations, respectively. The schematic of the ZIKV genome to the right of the graph is distorted to show the relative abundance of insertions in each region after passaging. (B) To determine the insertional tolerance of each region of the ZIKV genome, the number of mutants selected at a level >2 standard deviations above average in passage 2 was divided by the total number of mutants in the genomic region in the input library. The values were then set relative to an arbitrary value of 1 for the region that best tolerated insertions in each replicate of the screen. The values displayed are the averages for the three replicate screens, while the error bars represent the standard deviations.

