
FIG 4.
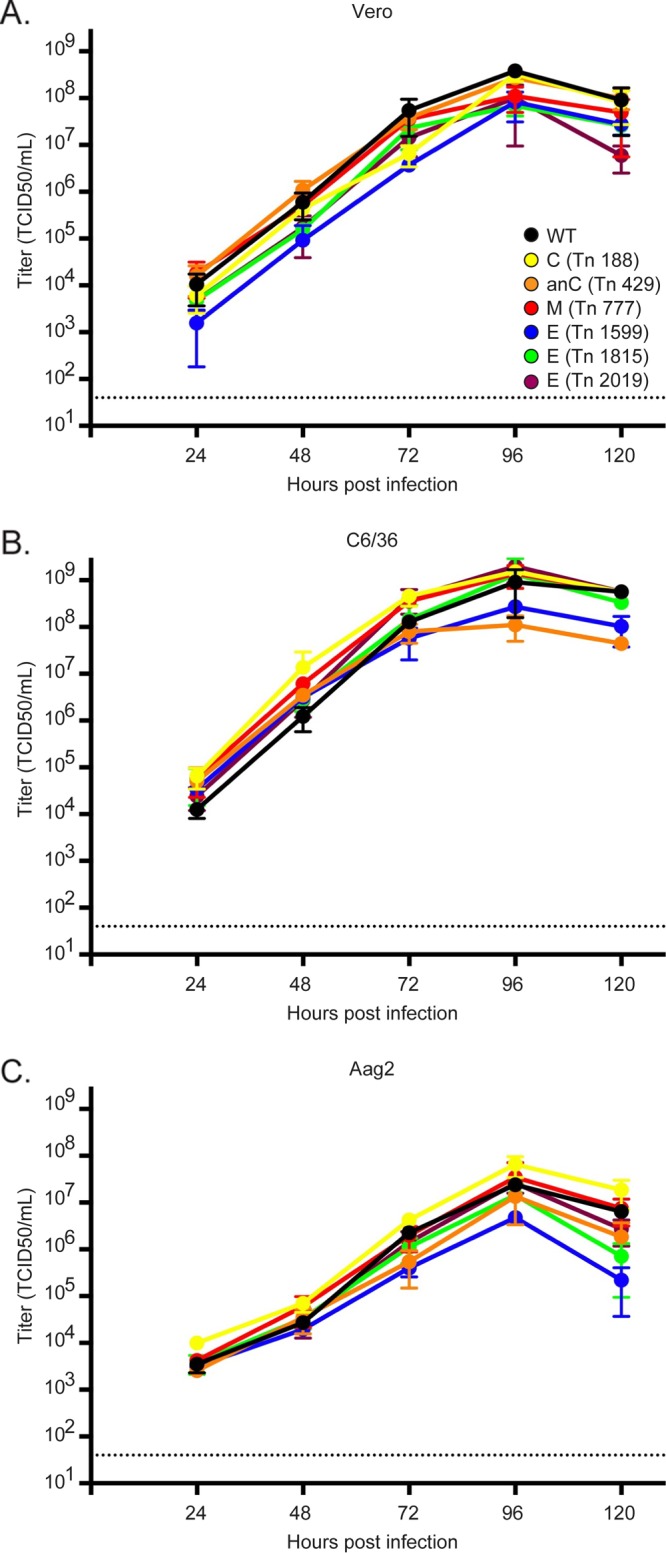
Viruses bearing insertions in the structural genes grow to high titers in mammalian and mosquito cells. Growth curves are shown for insertional mutants (colored lines) in comparison to the wild-type virus (black lines) in Vero (A), C6/36 (B), and Aag2 (C) cells. Cells were infected at an MOI of 0.01. Supernatants were collected at the indicated time points and titrated by TCID50 assays. Data points are the means for three replicates, while the error bars represent the standard deviations. The horizontal dashed line in each panel represents the limit of detection.