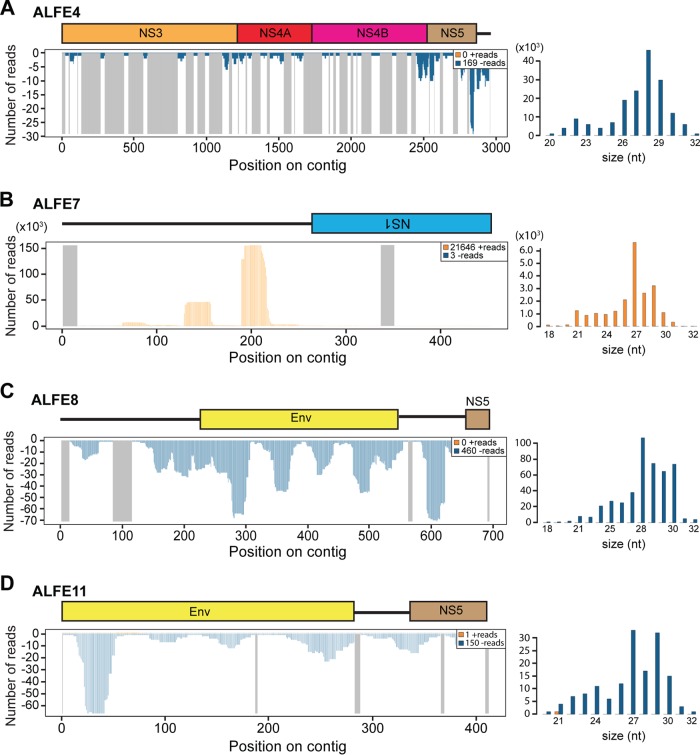
FIG 7.
Small RNA production from ALFE4, -7, -8, and -11. The small RNA profiles (left) and size distribution (right) of small RNAs mapped to the ALFE4 (A), ALFE7 (B), ALFE8 (C), and ALFE11 (D) sequences are shown. The schematic representation in each panel indicates each ALFE and its flanking region. The x axis represents the nucleotide position on the contig. The y axis shows the number of reads for each nucleotide position. Orange and blue, positive- and negative-stranded small RNAs, respectively; gray lines in the left panels, uncovered regions.

